First Time Fix Rate: A Field Service Manager's Guide
By MDMS Team · 30 July 2026

First Time Fix Rate: A Field Service Manager’s Guide
TL;DR:
- First-time fix rate measures the percentage of service jobs fully resolved on the initial visit without a return trip. Improving FTFR reduces costs, increases customer satisfaction, and boosts technician productivity by addressing key issues like parts availability and dispatch matching. Benchmarking against similar equipment verticals and implementing targeted operational changes can lead to measurable progress within three months.
First-time fix rate (FTFR) measures the percentage of service jobs your technicians resolve completely on the first visit, without a return trip. The formula is straightforward: divide the number of jobs fixed on the first visit by the total number of eligible jobs dispatched, then express the result as a percentage. According to Aquant’s 2025 benchmark data, the industry median sits around 75%, with top-performing teams reaching approximately 86%. If your FTFR is relatively low, repeat visits are likely consuming a measurable share of your scheduling capacity and eroding customer confidence. Every percentage point you recover translates directly into fewer truck rolls, lower parts-expediting costs, and more available technician hours.

Table of Contents
- What counts as a first-time fix?
- How do you calculate first-time fix rate?
- Why does FTFR matter to your business?
- What is a good FTFR for your vertical?
- What causes low FTFR in field service operations?
- How do you measure FTFR accurately?
- How do you improve first-time fix rate this quarter?
- Which software features actually move FTFR?
- How a dealer management system lifted FTFR: an Australian example
- How to run a 30/60/90 FTFR improvement project
- Key Takeaways
- The measurement trap most teams fall into
- How Moderndms helps Australian dealers lift FTFR
- Useful sources
- FAQ
What counts as a first-time fix?
A job qualifies as a first-time fix when a technician arrives on site, diagnoses the fault, and resolves it fully within that single visit — no return trip required to complete the repair. The work order closes with the asset back in service. That definition sounds simple, but the edges get messy fast.
What to include:
- Reactive repair calls where the technician was dispatched to diagnose and fix a reported fault
- Warranty repairs completed on a single visit
- Preventive maintenance calls that uncover and resolve an unexpected fault in the same visit
What to exclude:
- Planned multi-visit work: commissioning, staged installations, or multi-day overhauls. Including these drags the metric down and hides your actual repair performance
- Parts-order-only visits where the technician diagnoses but cannot fix because a part must be sourced (this is a parts-availability failure, tracked separately)
- Administration-only closures: warranty paperwork, compliance sign-offs, or inspection-only visits with no repair scope
- Triage-only interactions where a phone call or remote session resolves the issue without any on-site visit
FTFR vs. first contact resolution (FCR): FCR counts problems resolved without any on-site visit at all, typically through a call centre or remote support channel. FTFR counts problems resolved on the first physical visit. Both metrics matter, but they measure different things. A high FCR deflects truck rolls entirely; a high FTFR means the truck rolls that do happen are productive.
Common edge cases your team will debate:
- A technician completes the repair but calls the depot for 20 minutes of remote guidance mid-job. This still counts as a first-time fix — the visit resolved the fault.
- A technician fixes the primary fault but a second unrelated fault is found and requires a return visit. Most teams count this as a fix for the original job and a new job for the follow-up.
- A job is closed and the customer calls back within 30 days reporting the same fault. This is a repeat visit and the original job should be reclassified as a failure.
Agreeing on these rules before you start measuring is the single most important governance step your team can take.
How do you calculate first-time fix rate?
The formula:
FTFR (%) = (Jobs resolved on first visit ÷ Total eligible jobs dispatched) × 100
The numerator is the count of jobs where the technician arrived, diagnosed, and fully resolved the fault in one visit. The denominator is every eligible job dispatched during the measurement period — after removing planned multi-visit work, admin-only closures, and parts-order-only visits.
Why a 30-day measurement window matters
A 30-day window is the recommended industry practice. Teams that use 7–14 day windows frequently inflate their FTFR because a callback that arrives on day 12 or day 18 gets counted as a new, unrelated job rather than a repeat visit. The 30-day rule captures related callbacks and gives you a truer picture of first-visit resolution.
Worked example
Your team dispatches a number of jobs in a calendar month. After removing exclusions, the eligible job count is calculated accordingly.
| Category | Count |
|---|---|
| Planned multi-visit projects (excluded) | 8 |
| Parts-order-only visits (excluded) | 7 |
| Admin/inspection-only closures (excluded) | 5 |
| Eligible jobs (denominator) | 100 |
| Jobs resolved on first visit (numerator) | 77 |
| FTFR | 77% |
That 77% sits just above the industry median. It also tells you that 23 eligible jobs required a return visit — each one representing a second truck roll, additional labour, and a customer who waited longer than necessary.
Pro Tip: Lock your exclusion rules in writing before you run your first calculation. If your dispatcher and your service manager define “eligible job” differently, your FTFR numbers will never reconcile.
Why does FTFR matter to your business?
A single repeat visit costs more than most managers account for at the time. There is the direct cost: a second truck roll, additional technician hours, expedited parts freight, and the scheduling slot that gets displaced. Then there is the indirect cost: a customer whose asset sat idle longer than it should have.
Direct cost drivers from repeat visits:
- Fuel and vehicle wear for a second dispatch
- Labour time for travel, re-diagnosis, and repair
- Parts expediting fees when the correct part was not on the van
- Administrative overhead to reopen and rebook the work order
Capacity and scheduling impact: Every repeat visit consumes a scheduling slot that could have gone to a new job. A significant share of monthly jobs requiring a return visit effectively creates a shadow workload of unplanned jobs. That backlog compounds quickly during peak seasons, which is a particular pressure point for Australian agricultural and construction dealers working around harvest and project cycles.
Customer retention and contract compliance: Low FTFR correlates with lower customer retention, poorer service contract compliance, and reduced asset uptime. Customers on maintenance contracts expect their equipment back in service within a defined window. A repeat visit breaks that promise and creates a paper trail that surfaces at contract renewal time.
The metric also responds quickly to operational changes. Teams that fix intake processes, parts availability, and dispatch matching often see measurable improvement within a single quarter — which makes FTFR one of the faster-moving KPIs in your service operation.
What is a good FTFR for your vertical?
There is no single “good” number that applies across all equipment types. A pest-control operator running standardized treatments on residential properties can realistically target 90%+. A heavy-machinery dealer servicing mining equipment in remote Western Australia is doing well at 65–70%, because asset complexity, parts lead times, and site access constraints set a lower practical ceiling.
Benchmark ranges to orient your targets:
- Median across field service industries: approximately 75% (Aquant 2025 data, 30-day window)
- Top 20% of field service teams: approximately 86%
- High-complexity equipment verticals (mining, large construction, agricultural machinery): realistic targets often sit in the 65–75% range
- Lower-complexity verticals (HVAC, pest control, light commercial): 80–90% is achievable with good process discipline
Practitioner guidance is consistent on one point: benchmark against similar equipment verticals rather than a cross-industry average. A mining equipment dealer comparing their FTFR to a national HVAC benchmark will always look underperforming, even when their operation is genuinely well-run.
Setting your internal target:
- Establish your current baseline using the 30-day window and agreed exclusions.
- Identify your biggest failure category (parts, skills mismatch, triage gaps) — this tells you where your ceiling is.
- Set a 90-day improvement target of 3–5 percentage points above baseline, not a leap to the industry top quartile.
- Revisit the target after 90 days with real data.
Pro Tip: When benchmarking, filter your own data by job type before comparing to any external figure. Your FTFR on forklift hydraulic repairs will look very different from your FTFR on engine diagnostics — and averaging them together hides both problems and strengths.
What causes low FTFR in field service operations?
Most repeat visits trace back to one of six root causes. Auditing these in order gives you the fastest path to improvement.
-
Missing parts or poor van-stock visibility. A technician arrives with the wrong parts or no parts at all because the van inventory was not checked before dispatch. Parts-related failures account for a large share of FTFR failures across many field service teams — making this the single highest-leverage fix available.
-
Mismatched dispatch: skills vs. proximity. The nearest available technician gets the job, but they lack the certification or experience for that asset type. The visit produces a diagnosis but not a resolution. Example: a general service tech dispatched to a fault on a specialized hydraulic system they have not been trained on.
-
Incomplete asset history or documentation. The technician arrives without knowing what was done on the last three visits, which parts were replaced, or whether a known recurring fault exists. They spend the first 30 minutes reconstructing context that should have been in the work order.
-
Poor triage and intake data. The job was booked with a vague symptom description (“machine not working”) rather than specific fault information, model number, serial number, and operating conditions. The technician cannot pre-stage the right parts or tools because they do not know what they are walking into.
-
Scheduling pressure with no time buffers. The day is packed with back-to-back jobs, so when a repair turns out to be more complex than expected, the technician closes the job partially complete and moves on. The customer calls back the next day.
-
No remote pre-diagnosis or guided troubleshooting. The team sends a technician on-site for every reported fault without first attempting remote triage. Some of those faults could be resolved by phone or video call; others could at least confirm the required parts before the truck rolls.
How do you measure FTFR accurately?
Clean measurement is what separates a metric you can act on from a number that just looks good in a report. These rules keep your FTFR data reliable.
Measurement window:
- Use a rolling 30-day window. Shorter windows (7–14 days) miss callbacks that arrive in the second or third week and inflate your score.
- Apply the window consistently — do not switch between monthly and weekly counts depending on which looks better.
Exclusion rules (apply before calculating):
- Remove all planned multi-visit jobs: staged installations, commissioning, and scheduled overhauls that were never intended to complete in one visit.
- Remove admin-only closures: warranty paperwork, compliance inspections, and sign-off visits with no repair scope.
- Remove triage-only interactions where no technician was dispatched on-site.
- Flag parts-order-only visits separately so you can track parts-driven failures as a distinct metric.
Data-quality procedures:
- Link every callback work order to its parent job using a reference number or linked-ticket field. Without this link, callbacks look like new jobs and your FTFR is overstated.
- Use auto-classification in your service management software to tag job types at creation, not at closure. Manual tagging at closure is inconsistently applied.
- Run a monthly manual review of all jobs closed within 30 days of a callback on the same asset. Reclassify any that meet the repeat-visit definition.
- Assign one person (typically the service manager or a data analyst) as the metric owner who approves classification changes.
Auditability checklist:
- Written exclusion rules, version-controlled and accessible to dispatch and service teams
- Work-order linking protocol documented in your job-creation workflow
- Monthly reconciliation report comparing raw job count to eligible job count
- Quarterly review of exclusion categories to check for scope creep
How do you improve first-time fix rate this quarter?
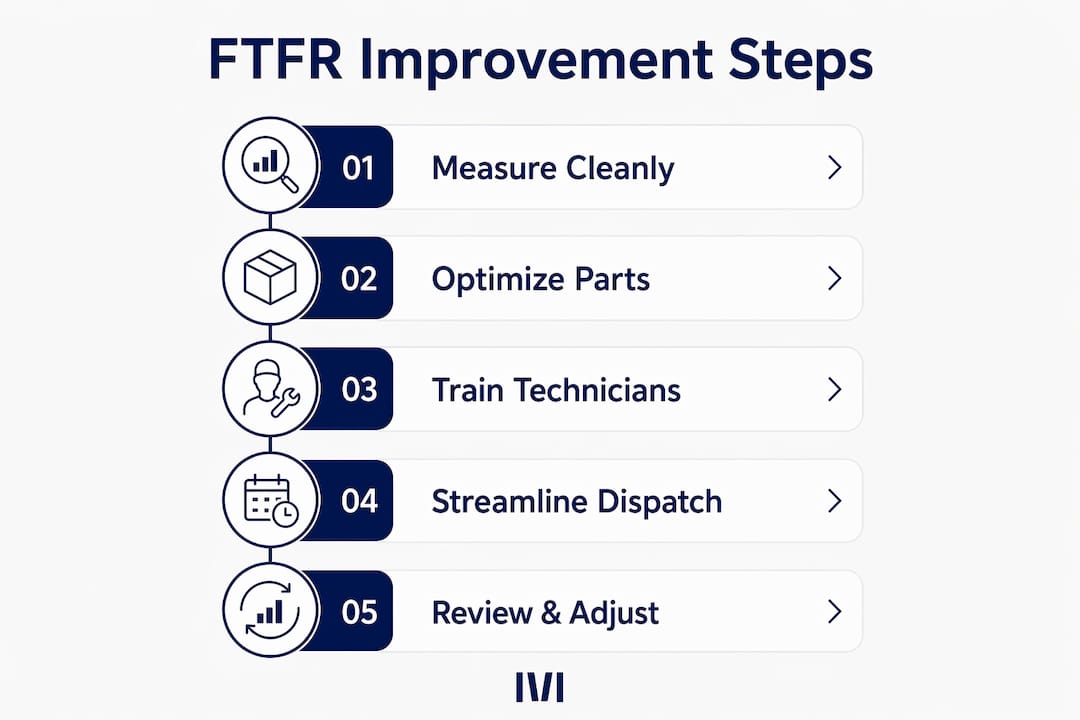
FTFR responds quickly to concentrated operational changes. The improvements below are sequenced by impact: upstream fixes first, then parts and inventory, then skills and scheduling.
30-day quick wins
-
Tighten intake forms. Require model number, serial number, reported symptom, and at least one photo before a job is created. A technician who knows the exact fault and asset configuration can pre-stage parts and tools before leaving the depot.
-
Run a van-stock audit. Pull the last 90 days of parts-related repeat visits and identify the 10–15 parts that appear most frequently. Set minimum stock levels for those parts on your highest-utilization vans. Parts and inventory visibility is the fastest single lever most teams have available.
-
Add a pre-dispatch checklist. Before any technician leaves, confirm: correct parts on van, asset history reviewed, access confirmed with the customer, and correct manuals or schematics loaded on the mobile device. Pre-dispatch kitting consistently produces faster FTFR gains than additional technician training alone.
-
Tag technician certifications in your dispatch system. Even a simple spreadsheet that maps technician names to asset types and certifications will stop mismatched dispatches. Skills-based routing is a medium-term software feature; the manual version can start this week.
90-day medium-term initiatives
-
Implement remote triage before dispatch. Route all new fault reports through a 10-minute phone or video triage step. This either resolves the fault without a truck roll (improving FCR) or confirms the parts and skills required before dispatch (improving FTFR).
-
Build decision trees and mobile knowledge bases. Common fault types on your most-serviced assets should have documented diagnostic paths accessible on the technician’s mobile device. This reduces on-site diagnosis time and the likelihood of a partial fix.
-
Set up min/max replenishment rules for van stock. Manual van-stock audits are a quick win; automated replenishment rules are the sustainable version. When a part drops below minimum, a purchase order or transfer request is triggered automatically.
-
Introduce complexity flags on job creation. Jobs above a defined complexity threshold get a longer time allocation and a senior technician assignment. This prevents the scheduling-pressure failure mode where a complex job gets squeezed into a standard time slot.
Pro Tip: Run your first 30-day improvement sprint on a single job type or asset category rather than across your whole operation. A focused pilot gives you clean before/after data and builds internal confidence before you roll out changes more broadly.
Which software features actually move FTFR?
The right platform does not just report your FTFR — it removes the friction that causes repeat visits in the first place. When evaluating field service management software for Australian operations, map each feature to a specific FTFR lever.
| Software feature | FTFR lever | Why it matters |
|---|---|---|
| Mobile offline app | On-site resolution | Technicians in low-connectivity sites (mining, rural) can access job notes, asset history, and manuals without signal |
| Real-time van-stock visibility | Parts availability | Dispatch can confirm parts are on the van before the job is assigned |
| Pre-dispatch kitting workflow | Parts availability | System prompts parts confirmation before job status moves to “dispatched” |
| Skills and certification profiles | Dispatch matching | Routing logic filters technicians by certification, not just proximity |
| Asset history and service records | Diagnosis quality | Technician sees full fault history before arriving, reducing re-diagnosis time |
| Structured intake/triage forms | Intake data quality | Captures model, serial, symptom, and photos at job creation |
| Remote support integration | Truck-roll avoidance | Video or guided troubleshooting resolves faults before dispatch or confirms parts |
| Linked work orders (parent/child) | Measurement accuracy | Callbacks link to parent jobs automatically, preventing FTFR inflation |
| Reporting and dashboards | Metric governance | FTFR by technician, job type, and asset visible in real time |
Vendor evaluation questions for Australian demos:
- Does the mobile app work fully offline, including parts lookup and job closure? Australian field sites frequently have no reliable connectivity.
- Does the system integrate with Xero or MYOB for GST-compliant invoicing without manual re-entry?
- Can you configure exclusion rules (multi-visit jobs, admin closures) natively, or does it require custom development?
- Who owns the data if you cancel the subscription? Data portability matters for Australian dealers who have been burned by legacy vendor lock-in.
- Can you run a modular rollout — starting with service and parts — without committing to a full platform implementation upfront?
Integration with your parts system and ERP is particularly important. If parts data lives in one system and job data lives in another, your pre-dispatch kitting workflow will always be a manual step — and manual steps get skipped under scheduling pressure.
How a dealer management system lifted FTFR: an Australian example
The following example is based on a composite of operational patterns common among Australian equipment dealers that have moved from paper-based or spreadsheet-driven service operations to a purpose-built dealer management system.
Before the system change:
| Metric | Before |
|---|---|
| Average time to locate asset history | 15–20 minutes per job |
| Pre-dispatch parts confirmation | Manual, inconsistent |
The service team was running job cards on paper and reconciling parts usage in a separate spreadsheet. Technicians frequently arrived on site without the correct parts because no one had checked van stock against the job requirements before dispatch. Asset history was stored in a filing cabinet at the depot, which meant technicians in the field were working from memory or calling the office.
After implementing a dealer management system with parts visibility, mobile job notes, and pre-dispatch kitting:
| Metric | After (90 days) |
|---|---|
| FTFR (30-day window) | 77% |
| Parts-related repeat visits | 40–50% of all repeat visits |
| Average time to locate asset history | Under 2 minutes (mobile access) |
| Pre-dispatch parts confirmation | Systematic, logged in work order |
The 12-percentage-point improvement came primarily from two changes: real-time van-stock visibility that allowed dispatch to confirm parts before assigning jobs, and mobile access to asset history that eliminated the 15-minute on-site scavenger hunt for prior service records.
Implementation pitfalls to avoid:
- Do not run parallel paper and digital systems for more than two weeks. Parallel systems create data gaps that corrupt your FTFR baseline.
- Train dispatch staff on the new workflow before technicians. Dispatch is where most FTFR failures originate.
- Set your exclusion rules in the system before you go live, not after your first month of data.
Pro Tip: Capture your FTFR baseline using the 30-day window in the two months before go-live. Without a clean pre-implementation baseline, you cannot demonstrate the improvement — and you need that data to justify the next phase of the rollout.
How to run a 30/60/90 FTFR improvement project
A structured project plan prevents the common failure mode: a burst of enthusiasm in week one, followed by no measurement and no accountability by week six.
30/60/90 activity plan
Days 1–30: Measure and diagnose
- Agree on your FTFR definition, exclusion rules, and measurement window in writing.
- Pull 90 days of historical job data and calculate your baseline FTFR.
- Categorize all repeat visits by root cause: parts, skills, triage, scheduling, or other.
- Identify the top two root causes and assign an owner to each.
- Run a van-stock audit and update minimum stock levels for the top 10–15 high-frequency parts.
Days 31–60: Implement quick wins
- Update intake forms to require model, serial, symptom, and photo.
- Activate pre-dispatch kitting checklist in your work-order workflow.
- Tag technician certifications in your dispatch system and apply skills-based routing for the top five asset categories.
- Run weekly FTFR reviews with dispatch and service leads.
Days 61–90: Consolidate and extend
- Introduce remote triage for all new fault reports.
- Build decision trees for the three most common fault types on your highest-volume assets.
- Set up automated min/max replenishment rules for van stock.
- Run a full 30-day FTFR calculation and compare to baseline.
Sample KPI dashboard items
- FTFR overall (30-day rolling)
- FTFR by job type (reactive repair, warranty, preventive maintenance)
- FTFR by technician
- Parts-related repeat visit rate (parts failures as % of all repeat visits)
- Repeat-visit reason codes (parts, skills, triage, scheduling, other)
- Average time to locate asset history (proxy for documentation quality)
Roles and responsibilities
- Service manager: metric owner, approves classification changes, runs monthly review
- Dispatch team: applies exclusion rules at job creation, confirms pre-dispatch kitting
- Parts/warehouse team: maintains van-stock levels, processes replenishment requests
- Technicians: complete intake data fields, log asset history notes at job closure
- Data analyst or operations lead: runs monthly reconciliation, flags anomalies
Pilot before full rollout. Run the first 30-day sprint on one job type or one technician team. Clean pilot data is more persuasive than messy fleet-wide data when you are making the case for a larger system investment.
Key Takeaways
A first-time fix rate above 75% requires clean measurement rules, real-time parts visibility, and skills-matched dispatch — not just more technician training.
| Point | Details |
|---|---|
| Use a 30-day window | Shorter windows inflate FTFR by missing related callbacks; 30 days is the industry standard. |
| Exclude planned multi-visit jobs | Remove commissioning, staged installs, and admin-only closures before calculating your denominator. |
| Parts failures drive repeat visits | Parts-related issues account for approximately 40–50% of repeat visits; van-stock visibility is the fastest lever. |
| Benchmark by vertical | Compare your FTFR to similar asset types, not a cross-industry average that ignores equipment complexity. |
| Moderndms supports FTFR improvement | Moderndms provides parts visibility, mobile offline access, and pre-dispatch kitting workflows built for Australian equipment dealers. |
The measurement trap most teams fall into
Most FTFR improvement programs stall not because the tactics are wrong, but because the measurement was never clean to begin with. The most common trap: a service manager celebrates a jump from 68% to 81% FTFR, only to discover three months later that the team had quietly stopped logging callbacks against their parent jobs. The metric improved on paper because the repeat visits became invisible, not because fewer of them happened.
The second trap is subtler. Teams focus heavily on technician training as the primary lever, running skills workshops and certification programs, while the real problem is sitting in the dispatch queue: jobs being assigned by proximity rather than capability, and vans leaving the depot without the right parts. Training matters, but it rarely moves FTFR as fast as fixing the upstream process. A well-trained technician who arrives without the correct part still generates a repeat visit.
Pragmatically, the right order is: fix your measurement first, then fix your intake and parts processes, then invest in skills development. Cultural resistance is real in this sequence — technicians sometimes interpret intake-form requirements as distrust rather than support. The framing matters. Present pre-dispatch checklists and triage forms as tools that set technicians up to succeed, not as surveillance. Teams that get this framing right tend to see faster adoption and better data quality.
How Moderndms helps Australian dealers lift FTFR
Equipment dealers running paper job cards or disconnected spreadsheets are fighting FTFR problems with one hand tied behind their back. Moderndms is purpose-built for Australian equipment dealerships and maps directly to the operational levers that move first-visit resolution rates.
The parts and inventory module gives dispatch real-time van-stock visibility so parts are confirmed before a job is assigned, not discovered missing on site. The offline-capable mobile app means technicians in remote or low-connectivity sites can access full asset history, service records, and job notes without waiting for a signal. Pre-dispatch kitting workflows, skills-based routing, and structured intake forms are built into the service workflow, not bolted on as afterthoughts.
Moderndms integrates with Xero and MYOB for GST-compliant invoicing, runs on a modular rollout so you can start with service and parts without a full platform migration, and operates on monthly rolling contracts with no lock-in. Setup takes under an hour. For equipment dealers across Australia looking to run a focused FTFR improvement project this quarter, the platform gives you the measurement infrastructure and operational tools to do it without a large IT project. Book a demo or start a free trial at moderndms.com.au.
Useful sources
These references informed the analysis in this guide. Where benchmarks or measurement guidance come from non-Australian sources, apply them with the vertical-specific and operational-context adjustments described above.
- Field service KPIs: Formulas & Benchmarks — VSight: Covers FTFR formula, the 30-day measurement window rationale, and Aquant 2025 benchmark data (median ~75%, top 20% ~86%). Primary reference for calculation methodology and benchmark ranges.
- How to Improve First-Time Fix Rate in 2026 — FSM News: Tactical improvement guidance with emphasis on upstream fixes (intake, triage, parts) over training-first approaches. Useful for the improvement sequencing in this guide.
- First-Time Fix Rate: What Is It and How to Improve It? — MSI Data: Detailed breakdown of parts-related failure rates and remote support as a truck-roll avoidance strategy. Supports the parts-first improvement priority.
- First time fix rate glossary — Logicatalog: Practitioner-level guidance on vertical-specific benchmarking and why cross-industry averages mislead. Supports the target-setting methodology.
- What is first-time fix rate? — Simple Scheduler: Clear guidance on exclusions, particularly planned multi-visit projects and commissioning work. Supports the measurement rules in this guide.
- What Is First-Time Fix Rate & How to Improve Your FTFR — Comparesoft: Broader field service management context for FTFR, including software feature mapping. Useful supplementary reading for vendor evaluation.
When applying any benchmark from these sources to Australian operations, filter by your equipment vertical and asset complexity before setting targets. A figure drawn from a US or European HVAC population does not translate directly to a heavy-machinery dealer operating in Queensland or Western Australia.
FAQ
How do you calculate first-time fix rate?
Divide the number of jobs fully resolved on the first visit by the total number of eligible jobs dispatched in the period, then multiply by 100. Eligible jobs exclude planned multi-visit work, admin-only closures, and parts-order-only visits; use a 30-day measurement window to capture related callbacks accurately.
What is a good first-time fix rate?
The industry median is approximately 75% and top-performing teams reach around 86%, based on Aquant 2025 benchmark data. High-complexity equipment verticals such as mining and large construction typically have realistic ceilings of 65–75%, so compare your rate against similar asset types rather than a cross-industry figure.
What is the industry standard measurement window for FTFR?
A 30-day window is the recommended industry standard. Shorter windows of 7–14 days commonly inflate FTFR by counting related callbacks as separate successful jobs rather than repeat visits.
What is the most common cause of a low first-time fix rate?
Missing or incorrect parts is the leading cause, accounting for approximately 40–50% of FTFR failures across many field service operations. Addressing van-stock visibility and pre-dispatch kitting typically produces faster FTFR gains than any other single intervention.
How quickly can FTFR improve after operational changes?
Teams that fix intake processes, parts availability, and dispatch matching often see measurable improvement within a single quarter. A focused 30/60/90 project targeting the top two root causes is a practical structure for achieving a 3–5 percentage point gain within 90 days.