Rental Rate Calculation Methods for Equipment Businesses
By MDMS Team · 17 August 2026
Rental Rate Calculation Methods for Equipment Businesses
Use cost-plus pricing (ownership costs plus operating costs) as your baseline for every rental rate you set. It’s the only method that guarantees you cover your real expenses before profit enters the picture. Layer other methods on top depending on the situation:
- Market benchmarking to sanity-check a quote against live competitor rates
- Utilization-based pricing to optimize returns across your fleet
- Parametric or top-down estimating when you need a fast quote and don’t have time for a full buildup
The NSW DPI Primefact guidance on contract rates remains the clearest public worked example of this approach, and pairing it with IBISWorld benchmarks and a rental system like Moderndms turns a once-a-year spreadsheet exercise into an ongoing pricing discipline.
Key Takeaways
Accurate rental rates come from combining a cost-plus baseline with market checks and utilization data, not from guessing at last year’s numbers.
| Point | Details |
|---|---|
| Start with cost-plus | Calculate ownership and operating costs per productive hour before adding contingency and margin. |
| Use the 5%/20% guide | Apply roughly 5% contingency and 20% profit margin as a starting point, per NSW DPI Primefact methodology. |
| Validate against the market | Check two live competitor quotes and IBISWorld benchmarks before finalizing a rate. |
| Test for sensitivity | Model a 15% utilization drop and a 10% fuel increase to confirm your rate still covers costs. |
| Automate with Moderndms | Use the Moderndms rental module to keep utilization and cost data current and feed them directly into rate reviews. |
This article is general information, not a substitute for advice from a qualified financial advisor. Consult a qualified financial professional about your own circumstances before acting on anything here.
Table of Contents
- Why Accurate Rental Rate Calculation Protects Your Margins
- The Core Rental Rate Calculation Methods, Side by Side
- How to Calculate Rental Rates Using the Cost-Plus Method
- Using Market Checks, Utilization Data, and Quick Estimates Together
- Contingencies, Margin, and Sensitivity Testing
- Building Your Rental Rate Spreadsheet: A Field Checklist
- Software That Removes the Guesswork From Rate Calculations
- What Rental Operators Consistently Get Wrong
- Automate Rate Calculations With Moderndms Rental Tools
- Sources
- FAQ
Why Accurate Rental Rate Calculation Protects Your Margins
Getting your rental rate calculation methods wrong doesn’t just cost you a few dollars per job. It compounds across every hire, every month, until your fleet is working overtime just to break even.
The Australian rental market has grown increasingly price-sensitive, and short-term discounting has become common enough to trigger what amounts to a race to the bottom among smaller operators competing for the same jobs. When that happens, the businesses that undercut hardest are usually the first to defer maintenance to protect cash flow. That deferred maintenance shows up later as unplanned downtime, shortened asset life, and unhappy customers.
Rates built on real cost data protect you from that spiral. They also flow directly into your contract terms:
- Minimum hire periods that reflect true mobilization costs
- Transport and delivery fees that aren’t quietly absorbed into the base rate
- Damage liability clauses priced to reflect actual repair risk
The Core Rental Rate Calculation Methods, Side by Side
Five methods cover almost every pricing situation an equipment rental business will face. None of them is universally “best.” Each trades precision for speed differently.
- Cost-plus (bottom-up): Builds the rate from ownership and operating costs plus margin. Most accurate, slowest to compute, best for setting your baseline price list.
- Installation factor method: Applies a multiplier to a known cost base (like purchase price) to approximate ownership costs quickly. Faster than full cost-plus, less precise, useful for mid-sized fleets pricing many similar assets.
- Top-down/parametric: Uses historical data and statistical relationships (cost per hour by asset class, for instance) to generate rates in minutes. Fast, moderately accurate, ideal for quick estimating on high-volume quote requests.
- Market benchmarking: Anchors your rate to what competitors are actually charging right now. Fast, doesn’t account for your specific cost structure, best used as a check rather than a starting point.
- Utilization-based pricing: Adjusts rates based on how hard an asset actually works. Requires telemetry or usage logs, but it’s the most effective lever for fleet-wide profitability.
Decision rule: build your price list with cost-plus, validate it with market benchmarking, then refine it with utilization data as your fleet management matures. Reach for parametric shortcuts only when a customer needs a quote faster than a full buildup allows.
How to Calculate Rental Rates Using the Cost-Plus Method
Cost-plus pricing starts with two cost buckets. Ownership costs include depreciation, finance charges, registration, and insurance on the asset itself. Operating costs cover maintenance, fuel, tyres, consumables, and operator labor if you’re providing a wet hire.
Here’s the sequence:
- Add up annual ownership costs (depreciation + finance + registration + insurance).
- Divide by productive hours per year (not calendar hours; actual hours the machine earns revenue) to get an hourly ownership cost.
- Calculate operating cost per hour separately: fuel, maintenance reserve, tyres, and consumables divided by the same productive-hour base.
- Add ownership $/hr and operating $/hr together for your raw cost per hour.
- Add a contingency percentage and a profit margin to reach your final rate.
The NSW DPI Primefact worked example uses a 5% contingency and a 20% profit margin on top of the combined ownership-plus-operating figure, then shows how to convert that hourly rate into a per-hectare rate for agricultural contract work. The same math applies whether you’re pricing an excavator by the hour or a slasher by the hectare; you’re just changing the productivity unit in the denominator.
Say your combined ownership and operating cost comes to $85/hr.
Pro Tip: Don’t estimate productive hours from memory. Pull actual run-hour data from onboard telemetry or a fleet management system. Operators consistently overestimate utilization by guessing, and that single error can undercut your entire rate structure.
Using Market Checks, Utilization Data, and Quick Estimates Together
Cost-plus gives you a defensible number, but it shouldn’t be your only input. Three complementary methods sharpen that number for real-world quoting.
Market benchmarking means pulling two or three live quotes from competitors before you finalize a rate, comparing the all-in price (not just the base rate) including transport, insurance, and consumables. Run this check quarterly at minimum, or whenever you notice a shift in local demand. IBISWorld’s industry data gives you a broader benchmark for whether your regional pricing sits in line with national averages.
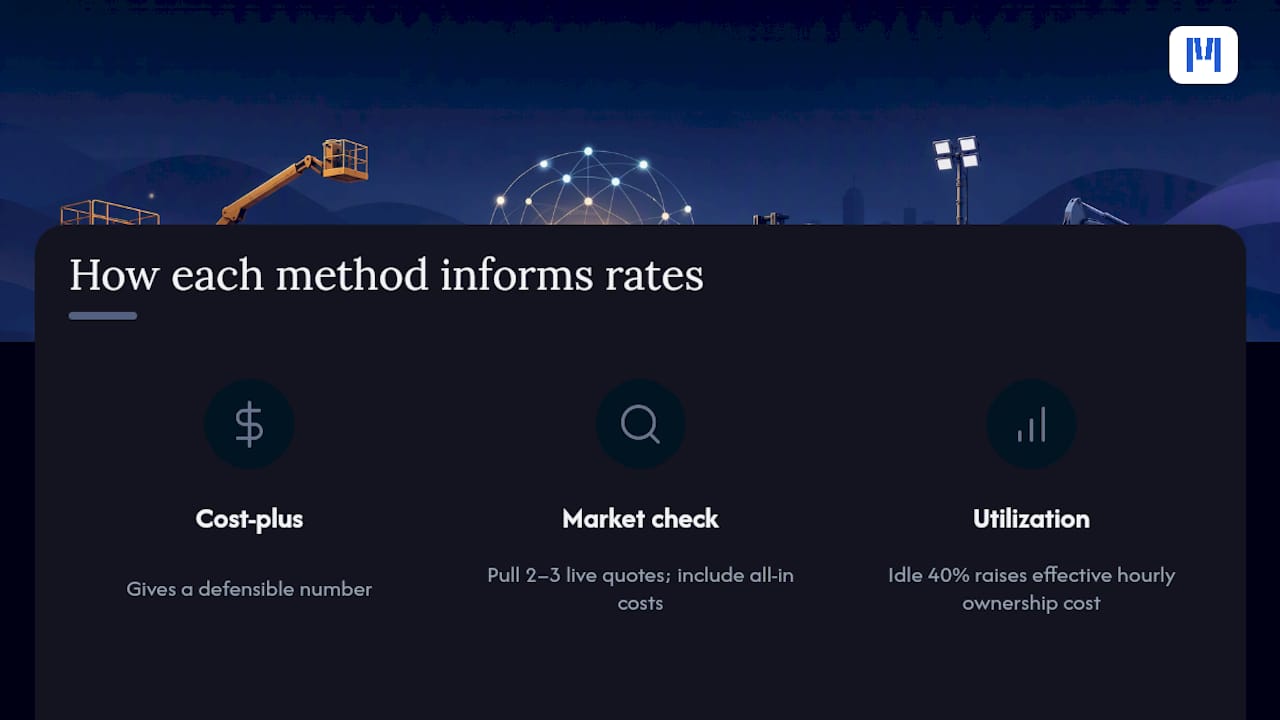
Utilization-based pricing asks a different question: how hard is this asset actually working? If a machine sits idle 40% of the time, its effective hourly ownership cost is far higher than the nameplate rate suggests. Some operators, following models similar to OEM-backed rental programs, tier their rates by expected utilization band, charging a premium for guaranteed availability and a discount for flexible, lower-priority bookings.
Parametric or top-down estimating trades precision for speed. It works by applying a historical cost-per-hour ratio to a new asset class, and it’s appropriate for fast quotes or early-stage budgeting, not for your final contract rate.
Contingencies, Margin, and Sensitivity Testing
A rate without contingency built in isn’t really a rate. It’s a guess that happens to look precise.
Common contingency items include transport and mobilization, accommodation for remote jobs, weather-related downtime, and office overheads like phone and admin time. The NSW DPI Primefact example applies a 5% contingency alongside a 20% profit margin, a reasonable starting range for most independent operators.
Once you’ve built a rate, stress-test it:
- Reduce utilization by 15% and check whether the rate still covers ownership costs.
- Increase fuel costs by 10% and see how much margin erosion follows.
- Model an extra week of unplanned downtime per year against your annual productive-hour assumption.
Pro Tip: Watch for two red flags: a quoted rate sitting well below the local market average, and a rate calculation that assumes near-100% utilization. Both usually mean someone skipped the sensitivity test.
Building Your Rental Rate Spreadsheet: A Field Checklist
You don’t need custom software to start. A spreadsheet with the right fields will get you most of the way there.
Collect these inputs for every asset:
- Purchase price, useful life, and salvage value
- Annual finance cost, registration, and insurance
- Annual maintenance spend and fuel cost per hour
- Tyres/tracks, operator labor (if applicable), and transport cost per job
- Productive hours per year and expected downtime percentage
Then follow this sequence:
- Calculate total annual ownership cost.
- Divide by productive hours to get ownership $/hr.
- Add operating cost $/hr (fuel, maintenance, consumables).
- Add contingency and profit margin percentages.
- Scale the resulting $/hr into daily and weekly tiers.
Before you lock the rate in, check it against two live market quotes, review telemetry for real utilization, and confirm your maintenance history matches what you budgeted.
Software That Removes the Guesswork From Rate Calculations
Spreadsheets work until your fleet grows past a dozen assets or your rates need updating more than once a quarter. At that point, manual recalculation becomes the bottleneck.
Fleet telematics track actual run hours instead of estimated ones. Depreciation calculators keep ownership costs current instead of relying on a figure from three years ago. Rental fleet modules built into a dealer management system connect utilization data directly to your rate tables, so a shift in fleet-wide usage triggers a review instead of going unnoticed for months.
The bigger gain is integration. When maintenance history and parts costs already live in the same system tracking your rental contracts, your operating cost inputs update themselves instead of requiring a manual pull every quarter.
Pro Tip: Set a utilization threshold, say, a 10-point swing, that automatically triggers a rate review instead of waiting for an annual pricing exercise.
What Rental Operators Consistently Get Wrong
The businesses that struggle with pricing usually aren’t bad at math. They’re relying on last year’s rate card, adjusted for inflation, instead of rebuilding the calculation from current cost data.
That’s the gap worth naming: a rate built two years ago on old fuel prices, old maintenance costs, and optimistic utilization assumptions doesn’t get more accurate with time. It gets worse, quietly, until a slow quarter exposes the shortfall. The fix isn’t a smarter formula. It’s treating rate calculation as a recurring operational task tied to real fleet data, not an annual spreadsheet ritual done once and forgotten.
Automate Rate Calculations With Moderndms Rental Tools
Running cost-plus calculations by hand works for a handful of assets. It breaks down once you’re managing a fleet of thirty machines with different maintenance histories, utilization patterns, and contract terms.
Moderndms brings ownership and operating cost data into one place instead of scattering it across spreadsheets, service records, and separate accounting software. The rental module tracks utilization automatically, feeds depreciation data straight into your rate calculations, and generates contract templates with your minimum hire terms and damage liability clauses already built in. Because it connects to service and parts data, your operating cost inputs stay current without a manual pull every quarter, and billing runs through the same system that tracks the hire. If your rate reviews currently depend on someone remembering to update a spreadsheet, book a walkthrough of the rental and hire fleet software and see how the calculations run against your actual fleet data.
Sources
- Guide to machinery costs and contract rates (PRIMEFACT 913)
- How to Estimate Equipment Cost in Construction | BuildMetric
- Australia Construction Equipment Rental Market Size, Report 2030F
- Transport Equipment & Large Vehicle Rental industry in Australia | IBISWorld
FAQ
What Is the Most Accurate Rental Rate Calculation Method?
Cost-plus pricing is the most accurate because it builds the rate from your actual ownership and operating costs rather than estimating from a competitor’s price or a historical average.
How Do I Calculate a Fair Rental Rate for Equipment?
Add annual ownership costs (depreciation, finance, registration, insurance) to operating costs (fuel, maintenance, tyres), divide by productive hours per year, then add a contingency and profit margin.
What Profit Margin Should I Use for Rental Rates?
The NSW DPI Primefact worked example uses a 5% contingency and a 20% profit margin on top of combined ownership and operating costs, a reasonable starting range for most operators.
How Often Should I Review My Rental Rates?
Review rates quarterly at minimum, and set utilization thresholds that trigger an automatic review whenever fleet usage shifts significantly, which tools like Moderndms can track automatically.
Should I Price Rentals Differently for Hourly, Daily, and Weekly Hire?
Yes. Scale your baseline hourly cost-plus rate into daily and weekly tiers with modest multi-day discounts that reflect reduced admin overhead per hire, not a proportional cost reduction.