8 Service KPIs That Fix WIP and Cash for Equipment Dealers
By MDMS Team · 10 September 2026

8 Service KPIs That Fix WIP and Cash for Equipment Dealers
Track eight service department KPIs every month and assign a named owner to each one: absorption rate, effective labor rate, hours per repair order, technician productivity, first-time fix rate, parts-to-labor ratio, fill rate, and work-in-progress cycle time with insights from the Australian automotive aftermarket marketing. The immediate next step is simple. Pick a dashboard, name who owns each number, and run one full baseline month before you set targets.
TL;DR:
- Tracking a baseline WIP cycle time for 30 days is essential before implementing changes to measure ROI effectively.
- Most dealerships have data capture issues, not KPI problems, which can be solved with integrated dealer management systems and automation.
- KPIs such as absorption rate, hours per repair order, and fill rate should be reviewed weekly by owners responsible for each metric.
- Establishing decision rules with thresholds helps trigger timely management reviews and avoid reactive responses to declining performance.
- Focusing first on the four core KPIs—absorption rate, effective labor rate, hours per RO, and first-time fix rate—provides clear insight into workshop profitability and quality.
Table of Contents
- What Are the Core Service Department KPIs?
- Who Should Own Each KPI, and How Often Should You Review It?
- Using a Dealer Management System to Close Your Data Gaps
- What Are Realistic Benchmarks for Service Department KPIs?
- How Do These KPIs Affect Customer Satisfaction and Retention?
- What Do Successful KPI Programs Look Like in Practice?
- Why KPI Discipline Only Works With Coaching Behind It
- Get Your Service Department KPIs Running on Real Data
- Sources
- FAQ
What Are the Core Service Department KPIs?
Fixed-ops profitability rarely comes down to one number. Dealership consultants recommend tracking a connected set of 15 or more KPIs rather than obsessing over a single metric, because workshop, parts, and field-service performance interact constantly. A standard fixed-ops KPI framework groups these metrics into three buckets, and each one earns its place on your dashboard for a distinct reason.
Workshop KPIs carry the most weight for most dealerships:
- Absorption rate measures what percentage of total fixed overhead your service, parts, and body operations cover through gross profit, independent of new and used equipment sales. Many dealerships aim for absorption rates around or above full coverage, treating fixed ops as the business rather than a cost center.
- Effective labor rate (ELR) is your actual realized labor revenue divided by hours billed. A shop quoting $145 an hour but realizing $110 has a discounting problem worth investigating.
- Hours per repair order flags whether technicians are quoting accurately and whether upsell opportunities are being missed on inspections.
- Technician productivity and efficiency track billed hours against clocked hours and against standard flat-rate times, respectively. Watching both reveals whether slowdowns come from training gaps or parts delays.
- First-time fix rate is the percentage of repairs completed correctly without a callback. A dip here often means diagnostic time is being shortchanged.
Parts KPIs determine whether your workshop has what it needs when it needs it:
- Parts-to-labor ratio benchmarks parts revenue against labor revenue on the same repair orders.
- Fill rate tracks what share of parts requests get filled from stock on the first attempt.
- Inventory turns shows how many times your parts stock cycles through in a year.
- Obsolescence and parts gross margin round out the picture, flagging dead stock and pricing discipline.
Field-service KPIs protect uptime and cash flow for customers running equipment on-site: mean time to repair (MTTR), response time from dispatch to arrival, schedule adherence, WIP cycle time, and parts-on-truck fill rate. A technician arriving without the right part turns a two-hour job into a two-day one.
Who Should Own Each KPI, and How Often Should You Review It?
KPIs die on spreadsheets nobody opens. Field-service governance frameworks work best when each role owns a small set of metrics tied directly to decisions that role actually makes, rather than a shared dashboard nobody feels responsible for.
- Service manager: owns absorption rate, ELR, hours per RO, first-time fix rate. Reviewed weekly, reported monthly.
- Parts manager: owns fill rate, inventory turns, obsolescence, parts-to-labor ratio. Reviewed weekly.
- Field service lead: owns MTTR, response time, schedule adherence. Reviewed daily on active jobs, summarized weekly.
- Finance: owns WIP cycle time and gross margin roll-ups. Reviewed monthly at the dealership level.
A one-page dashboard should show financial KPIs at the top (absorption rate, ELR, gross margin), operational KPIs below (hours per RO, fill rate, MTTR), a trend sparkline for each, and a short “top three actions” list updated at every review. Deloitte’s fixed-ops guidance points to monthly review cycles as the mechanism that builds an accountability culture, not the KPIs themselves.
Set decision rules before a threshold gets breached, not after. If absorption rate drops two points below target for two consecutive months, that triggers a service manager review meeting, not a shrug.
Using a Dealer Management System to Close Your Data Gaps
Most dealerships that struggle with KPIs don’t have a metrics problem. They have a data capture problem. Labor gets logged on paper, parts get pulled without a corresponding transaction, and repair orders stay open for days after the work is actually done.
An integrated dealer management system fixes this at the source. Automated labor capture ties technician time directly to the repair order the moment they clock in, eliminating the guesswork behind hours-per-RO reporting. Parts kitting attaches the right components to a job before the technician even starts, which keeps fill rate and parts-to-labor data accurate without manual reconciliation. Offline-capable field apps let technicians log job status from a site with no signal, so schedule adherence and MTTR numbers stay current instead of arriving three days late.
Three quick wins get most dealerships moving fast:
- Standardize labor entry so every technician logs time the same way, on the same fields.
- Turn on parts kitting for your top ten most common repair types.
- Set automated WIP closure alerts so repair orders don’t sit unbilled for a week.
Pro Tip: Run a 30-day baseline before changing anything. Measure your current WIP cycle time, then implement one change, then measure the delta. That short pilot is how you prove the ROI to ownership before rolling out further.
Moderndms sets up in under an hour and integrates with Xero, and dealership users have reported saving up to 10 hours a week on administrative work once labor capture and WIP reporting run automatically instead of through spreadsheets.
What Are Realistic Benchmarks for Service Department KPIs?
Benchmarks vary by equipment category, but the fixed-ops consensus gives you a reasonable starting range rather than a rigid target.
A high first-time fix rate is a reasonable target for most equipment categories, though complex hydraulic or electronic systems on heavy machinery can lower this metric without fault of the technician. High parts fill rates are achievable with disciplined stocking, and moderate inventory turns per year are common targets for equipment dealers with broad parts catalogs.
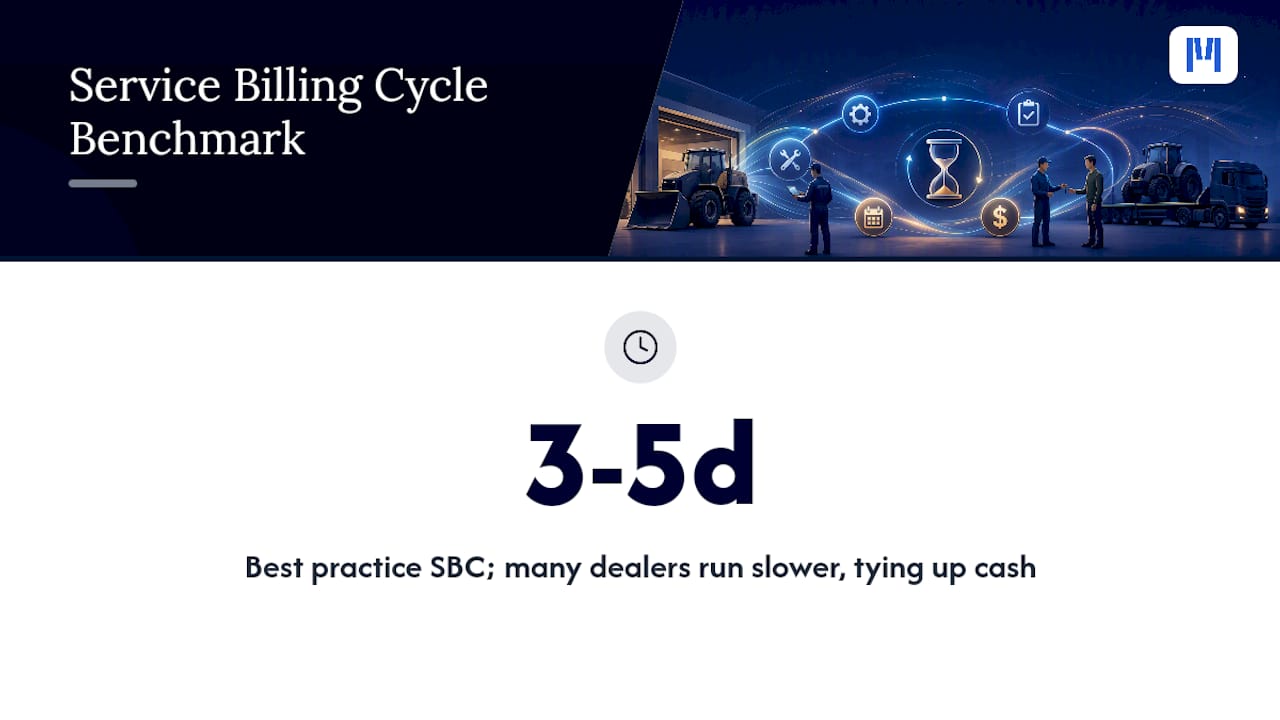
One metric that rarely makes standard KPI lists deserves attention here: Service Billing Cycle, the time between a technician’s final labor punch and the customer invoice going out. Best practice for heavy equipment sits at 3 to 5 business days. Most dealerships run well past that without realizing it, because nobody is tracking the gap between job completion and invoicing as its own number. Monthly KPI reviews that include labor sales, repair order counts, and absorption rate alongside SBC give you the fullest picture of where cash is actually getting stuck.
How Do These KPIs Affect Customer Satisfaction and Retention?
Every KPI on this list eventually shows up in a customer’s experience, whether you’re measuring it that way or not. A slow WIP cycle time means a customer’s invoice arrives late and often with billing questions attached, which erodes trust regardless of how good the actual repair was. A low first-time fix rate means equipment goes back into the shop for the same problem twice, and for a customer running that machine on a job site, a second visit is lost production time they will remember.
Response time and MTTR matter even more for field service customers, because downtime on a piece of heavy equipment often has a direct dollar cost attached. A dealership that consistently hits tight response windows becomes the shop customers call first, and the one they renew maintenance contracts with. Fill rate plays into this too. A technician who shows up without the right part turns one visit into two, and the customer notices the inefficiency even if they never see your internal parts data.
The connection runs both directions. Dealerships that track first-time fix rate and MTTR closely tend to catch service quality problems before they show up in customer complaints or online reviews. Treating these numbers purely as internal efficiency metrics misses half the value. They’re also an early warning system for retention risk, and tightening SBC to that 3 to 5 day range does more for perceived professionalism than almost any other single fix available to a service department.
What Do Successful KPI Programs Look Like in Practice?
Dealerships that turn KPI tracking into a real advantage tend to follow a similar pattern. They start narrow, measuring three or four metrics well before expanding, rather than trying to dashboard everything on day one. A service department that begins with just absorption rate, hours per RO, and first-time fix rate, measured consistently for a full quarter, usually finds it easier to build trust in the numbers than one that launches fifteen metrics at once and drowns the team in reporting.
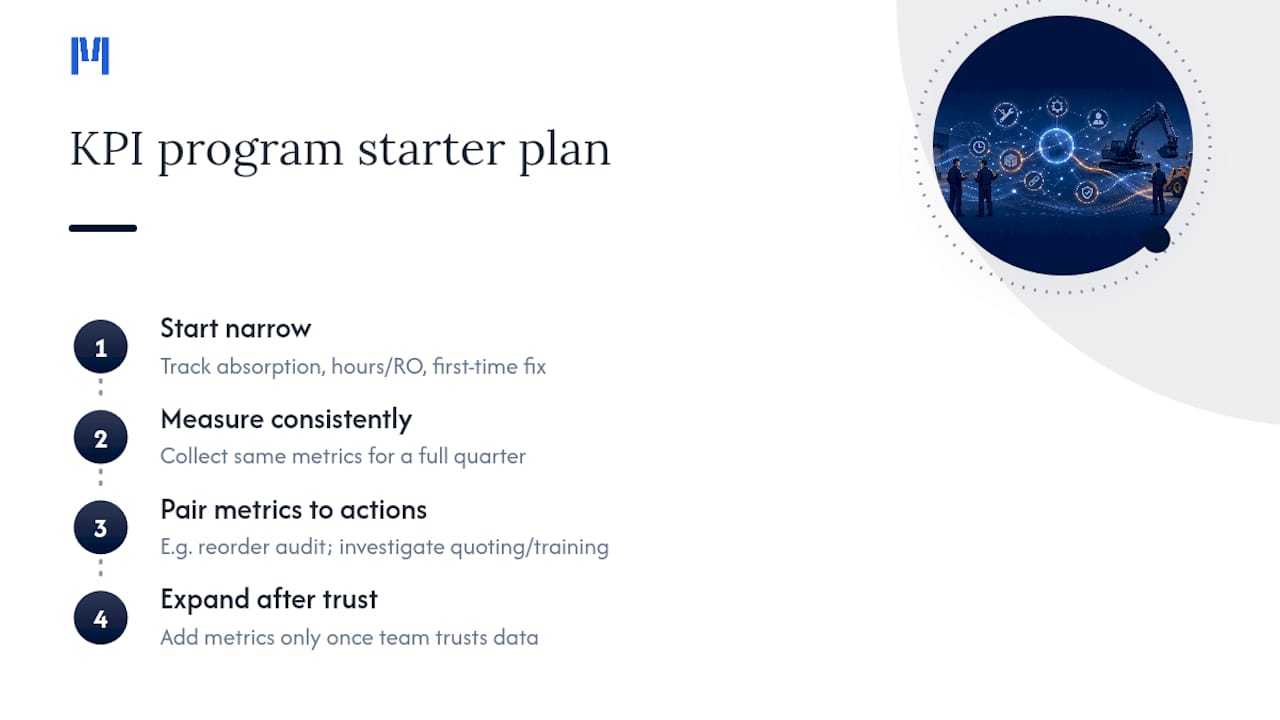
The common thread across dealerships that make KPIs stick is pairing the metric with a specific action tied to it. They run a reorder-point audit that week. A service manager who sees hours per RO creeping up investigates whether quoting has gotten sloppy or whether a specific technician needs additional training on a product line. The KPI is the trigger, not the endpoint.
Dealerships running field service alongside a workshop often see the fastest wins by tightening WIP cycle time first, since it’s the metric most directly tied to cash flow and the one most commonly ignored in standard reporting. Closing that gap from two weeks down to the recommended 3 to 5 business day window frequently surfaces enough recovered cash flow to fund further KPI tooling, which is often the argument that gets ownership fully on board with a broader measurement program.
Why KPI Discipline Only Works With Coaching Behind It
KPIs on a screen change nothing by themselves. What moves the needle is pairing that data with regular coaching conversations and transparent technician scorecards, so the numbers become a shared language between managers and the shop floor rather than a report card handed down from above. Start with a small pilot, one department, one quarter, and let the results make the case for expanding.
— ModernDMS
Get Your Service Department KPIs Running on Real Data
Spreadsheets and disconnected time clocks make KPI tracking a manual chore that falls apart the moment someone forgets to update a tab. Moderndms builds WIP reporting, automated labor capture, and parts kitting directly into the workflow your technicians already use, so absorption rate, hours per RO, and fill rate calculate themselves instead of waiting on someone’s Friday afternoon spreadsheet update.

Setup is quick, the platform connects to Xero for your finance team, and users retain ownership of their data without lock-in contracts. Many dealerships have found significant time savings on administrative reconciliation once labor and WIP data started flowing automatically.
If you run heavy equipment, trucks, forklifts, or construction machinery through your service department, the equipment dealer software page walks through exactly which modules apply to your operation. Book a demo and bring your current absorption rate and fill rate numbers. Within an hour you’ll see which parts of your KPI tracking can run automatically instead of manually.
Sources
Formulas only matter if the underlying data is clean. Here’s what feeds each calculation and where that data lives inside your dealer management system:
- Deloitte: fixed-ops KPI guidance
- DealerInt: Fixed Ops KPI Guide 2026
- SmartServiceOps: Field service KPIs
Three calculation traps show up constantly. Warranty repair orders get miscoded as customer-pay, inflating ELR. Parts get pulled from the shelf but never applied to the RO, which corrupts your fill rate and inventory turns simultaneously. And labor gets posted days after the job closes, which quietly wrecks your WIP cycle time reporting before anyone notices.
Pro Tip: *Run a monthly reconciliation between your labor punch data and your invoiced hours.
FAQ
What Are the Most Important Service Department KPIs to Track First?
Start with absorption rate, effective labor rate, hours per repair order, and first-time fix rate. These four give you the clearest read on workshop profitability and quality before you expand into parts and field-service metrics.
How Often Should Service Department KPIs Be Reviewed?
Operational KPIs like schedule adherence and MTTR benefit from daily or weekly checks, while financial roll-ups like absorption rate and gross margin are best reviewed monthly to support an accountability-driven review cycle.
What Is Service Billing Cycle and Why Does It Matter?
Service Billing Cycle measures the time between a technician’s final labor punch and the customer invoice. Best practice for heavy equipment targets 3 to 5 business days, and closing that gap improves both cash flow and customer perception.
Can a Dealer Management System Automate KPI Tracking?
Yes. A system like Moderndms captures labor, parts, and WIP data automatically at the point of work, which removes the manual spreadsheet reconciliation that causes most KPI reporting delays and errors.