Fix Repeat Visits in 30 Days: Parts Fill Rate Playbook for Dealers
By MDMS Team · 2 September 2026
Fix Repeat Visits in 30 Days: Parts Fill Rate Playbook for Dealers
Parts fill rate is the percentage of parts requests you can satisfy immediately from stock on hand, and it is the clearest signal you have of whether technicians and customers get what they need without a second trip. There’s no universal target, but most dealers treat a high fill rate as a working benchmark for high-demand stock. If your number sits meaningfully below that, it’s worth pulling the report today, because the gap usually shows up first in technician downtime and repeat visits.
TL;DR:
- A high parts fill rate is crucial for reducing technician downtime, repeat visits, and improving first-time fix rates, especially for critical parts.
- Calculating fill rate requires clear definitions of requests and requests filled from stock, with adjustments for lost sales, emergency, and special orders to ensure accuracy.
- Fill rate performance varies significantly across parts criticality and demand segments, making targeted tracking and accountability essential for meaningful improvements.
- Improving fill rate depends on better logging, planning discipline, and system integration to provide real-time data and prevent shortages before they occur.
- Pursuing near-perfect fill rates can require exponentially larger inventory investments, so focus on operational capability and visibility rather than solely maximizing the percentage.
Table of Contents
- What Parts Fill Rate Actually Measures
- How to Calculate Fill Rate Step by Step
- Why Fill Rate Drives FTFR, MTTR, and Cost
- The People, Process, and Technology Levers That Move the Number
- A Depot Scenario: Reading the Number Correctly
- What Fill Rate Improvement Delivers, and Where Teams Get It Wrong
- The Fill Rate Improvement Playbook
- Why We Treat Fill Rate as a Capability, Not a Warehouse Metric
- See How MDMS Handles Parts and Replenishment
- Sources
- FAQ
What Parts Fill Rate Actually Measures
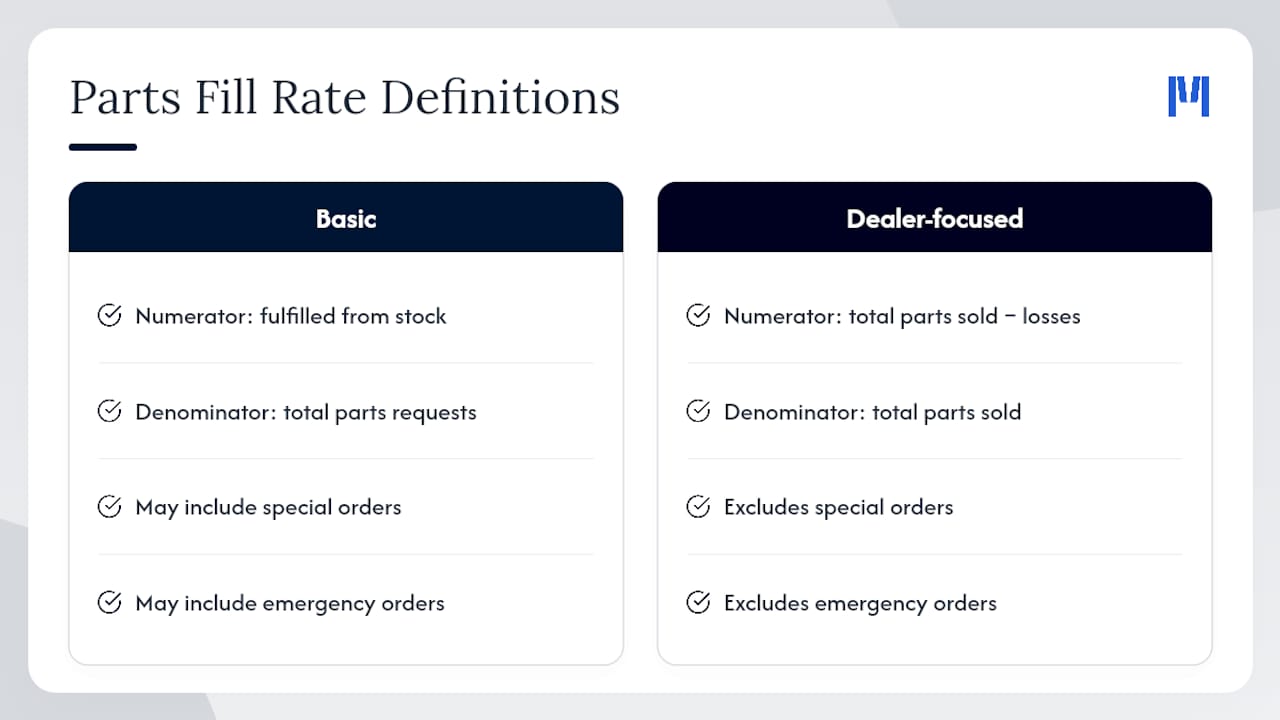
At its core, parts fill rate answers one question: when someone asks for a part, was it there? The formula is requests fulfilled from available stock divided by total parts requests, multiplied by 100. That sounds simple until you try to define “request.”
Some dealers count only counter and work-order line items. Others fold in special orders, which inflates the denominator and drags the percentage down. A dealer-focused version of the formula strips those out explicitly: total parts sold minus lost sales, minus special orders, minus emergency orders, divided by total parts sold. Neither approach is wrong, but they produce different numbers from the same data.
This matters because manufacturers, OEMs, and internal reporting tools often apply their own conventions. Before you compare your fill rate against a benchmark or a prior period, confirm what’s actually being counted. A “95% fill rate” that excludes emergency orders tells a very different story than one that includes them.
How to Calculate Fill Rate Step by Step
The cleanest way to calculate fill rate is to start with the basic formula, then layer in the adjustments that make it useful for real dealer operations.
- Count total requests. Every counter sale, work order line, and technician pull for a set period, typically a month.
- Count requests filled immediately from stock. No backorder, no special order, no substitution.
- Divide and multiply by 100. Filled requests ÷ total requests × 100 gives your baseline percentage.
- Subtract lost sales separately. If a customer walked away because you didn’t have the part and didn’t log it as a request, your fill rate is artificially inflated.
- **Track emergency and special orders as their own category, not buried inside “total requests.”
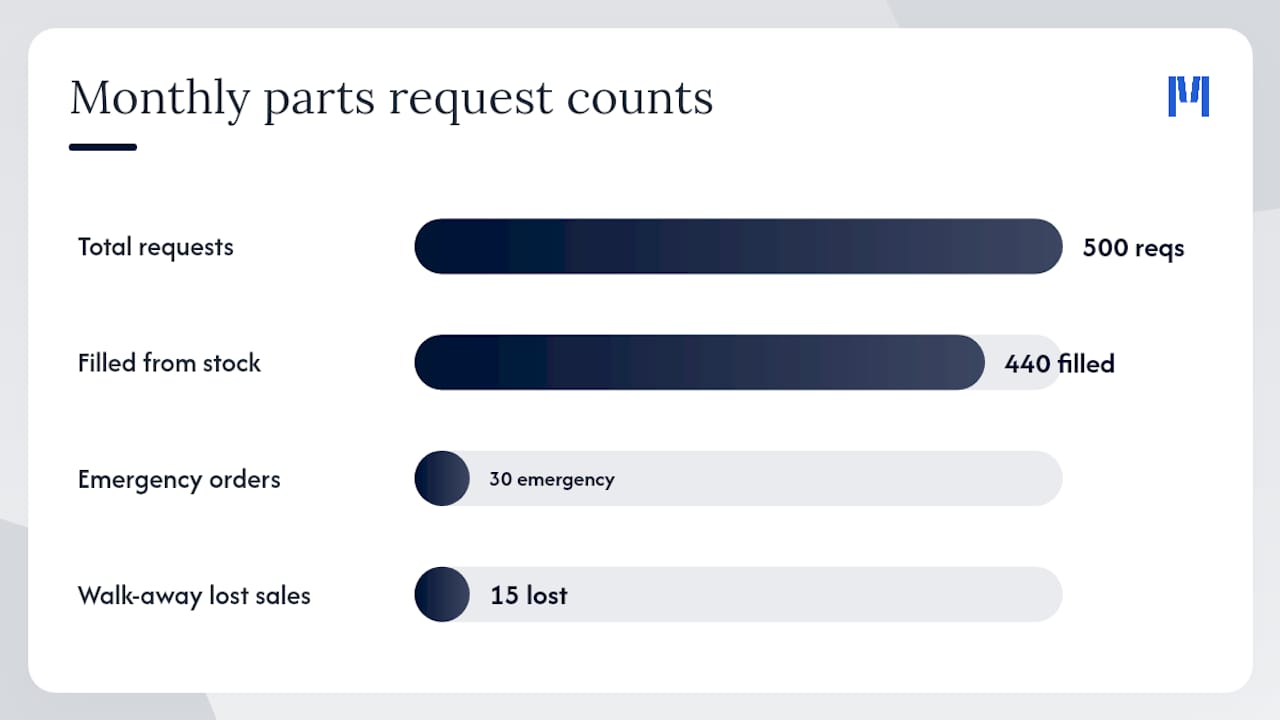
Here’s a worked example. A depot logs 500 parts requests in a month. 440 are filled straight from the shelf. But the depot also had 30 emergency orders and 15 walk-away lost sales that never made it into the counter system.
Aggregate the data at more than one level: by individual part, by criticality class, and by depot. A blended fill rate can look healthy while critical SKUs are quietly underperforming.
Why Fill Rate Drives FTFR, MTTR, and Cost
A missing part doesn’t just delay one job. It cascades. A technician who arrives without the right component either drives back to the depot or reschedules the customer, and both outcomes hit first-time fix rate (FTFR) and stretch mean time to repair (MTTR). Fill rate deterioration tends to show up before customer satisfaction scores drop, which is exactly why it works as a leading indicator rather than a lagging one.
Fill rate and OTIF (on-time, in-full) are related but not the same thing. Fill rate measures whether the part was available internally. OTIF measures the full delivery chain, timing and completeness together. A dealer can post a strong fill rate and still show weak OTIF if freight delays or dispatch errors break the chain after the part leaves the shelf.
The cost impact shows up in a few predictable places:
- Extra truck rolls and repeat technician visits
- Expedited freight to cover shortages that better planning would have caught
- Lost counter sales that never get logged, so they never get fixed
- Warranty and SLA penalties tied to missed response windows
Statistic Callout: Pursuing very high fill rates close to 100% often requires exponentially more inventory investment for each additional point, according to McKinsey’s analysis of on-time, in-full performance in the consumer sector. Treat fill rate as an operational capability worth funding deliberately, not a number to chase blindly.
The People, Process, and Technology Levers That Move the Number
Fill rate doesn’t improve because someone stares at a dashboard harder. It improves when three layers of the operation work together.
Frontline habits come first. Counter staff need a simple way to log lost sales, meaning any request you couldn’t fill on the spot, not just the ones that turned into a sale later. Technicians need a fast feedback channel back to planning when a van part runs short mid-job.
- Log every lost sale, even the ones that feel too small to bother with
- Standardize counter procedures so a “no stock” moment always gets recorded
- Build a short weekly loop where technician shortages reach the planner directly
Planning discipline is the second layer. Segment parts by criticality and velocity instead of managing one flat list. Mature operations avoid a single blended target and instead set expectations by part class, customer impact, and service entitlement, because a 90% target makes no sense applied equally to a $4 filter and a $4,000 hydraulic pump.
Technology ties the first two together. Near-real-time demand signals, and integration between your DMS, field service management, and ERP systems, close the gap between what a technician needs and what planning sees. Poor integration is what creates the fill-rate paradox: a warehouse full of slow-moving stock while the parts technicians actually need to sit on backorder.
Pro Tip: Assign one planner explicit ownership of fill rate by category. Without a named owner, shortages get treated as one-off emergencies instead of a pattern worth fixing.
A Depot Scenario: Reading the Number Correctly
Picture a two-depot dealer network running 1,200 combined parts requests a month. The blended fill rate comes back at a solid level on paper.
- Break it down by criticality. Once the team segments the data, the critical-parts category (hydraulic components, engine sensors) sits at 78%, while low-priority consumables sit at 97%. The blended average was hiding a real problem.
- Check for logging gaps. The depot with the weaker number also has no lost-sales log, so its true fill rate is likely worse than reported.
- Triage fast. The team starts a manual lost-sales notepad at both counters and rebuilds the van par list for the top 20 critical SKUs.
Within a month, critical-parts fill rate shows noticeable improvement, not because inventory doubled, but because the shortages finally became visible.
What Fill Rate Improvement Delivers, and Where Teams Get It Wrong
A stronger fill rate means fewer repeat visits, shorter MTTR, and fewer expedited freight charges eating into margin. Those gains are real and they compound over a quarter, not overnight.
The misconceptions are just as common as the benefits:
- Chasing 100% ignores the exponential cost curve near the top end
- Treating fill rate as purely a warehouse problem, when it’s really a planning and visibility problem
- Reporting one blended number that hides critical-part shortages behind healthy consumables data
- Skipping lost-sales tracking, which quietly overstates the real fill rate every month
The Fill Rate Improvement Playbook
Start with the moves that cost nothing but attention, then build toward the ones that require investment.
Quick wins (this month):
- Start a lost-sales log at every counter, a notepad or shared spreadsheet works fine to begin with, since the habit alone reveals real demand within weeks.
- Run a top-100 parts check against current stock and flag every gap.
- Rebuild van par lists around actual technician usage instead of guesswork from a year ago.
Medium-term (this quarter):
- Segment your full parts catalog by criticality and velocity, then set fill-rate targets per segment instead of one blanket number.
- Give planners a KPI tied specifically to their assigned category’s fill rate, with real accountability attached.
- Build a standing feedback loop between technicians and planning so shortages get flagged before they become emergency orders.
Strategic (this year):
- Move toward multi-echelon visibility across depots so one location’s surplus can cover another’s shortage before an emergency order gets placed.
- Integrate your DMS, field service, and ERP systems so demand signals travel automatically instead of through phone calls and spreadsheets.
- Adopt demand-sensing tools that flag seasonal swings before they hit the shelf, particularly for parts tied to weather-driven service spikes.
Pro Tip: When you report progress to leadership, show fill rate by criticality segment next to MTTR and repeat-visit counts. A single blended percentage rarely moves anyone’s decision; the connection to technician downtime does.
A wide-but-shallow stocking approach, carrying more SKUs in smaller quantities rather than deep stock on a narrow list, tends to lift counter fill rate without ballooning carrying costs. Pair that with clear planner ownership and you get a system that improves steadily instead of lurching between shortage and overstock.
Why We Treat Fill Rate as a Capability, Not a Warehouse Metric
Most software treats parts, service, and planning as three separate modules that happen to share a database. That’s backward. Fill rate breaks down at the seams between departments, not inside any one of them, which is why Moderndms builds parts, service, and planning as one connected workflow instead of three bolted-together screens.
When a technician logs a shortage in the field, that signal should reach a planner the same day, not surface three weeks later in a monthly report nobody reads closely. Modular rollout matters here too: a dealer can turn on parts and warehouse tracking first, prove out the lost-sales logging habit, and add deeper planning tools once the team trusts the data. Shorter feedback loops mean fewer emergency runs, and fewer emergency runs mean a fill rate number that reflects real planning discipline instead of last-minute scrambling.
*— ModernDMS
See How MDMS Handles Parts and Replenishment
Most fill rate problems trace back to disconnected systems, a parts counter that can’t see technician demand, a planner working from a spreadsheet that’s already a week stale. Moderndms closes that gap with parts and warehouse tools built into the same platform as service and field operations, so a technician’s shortage shows up where your planner can actually act on it the same day.
The parts and warehouse management module covers replenishment rules, van par lists, and stock visibility across depots, while broader parts and inventory workflows connect that data straight to service scheduling. Because MDMS rolls out module by module, you can turn on parts tracking now and add service or rental later without ripping out what already works. If you run an equipment dealership, the industrial and capital equipment dealer page shows how the pieces fit your specific operation. Setup runs under an hour, and there’s no long-term lock-in on your data. Request a demo and bring your current fill rate report. We’ll show you where the gaps are hiding.
Sources
- Parts Fill Rate: The Hidden Driver of Field Service Performance
- Your Parts Counter Has a Dirty Little Secret. It’s Called Fill Rate.
- Defining on-time, in-full in the consumer sector — McKinsey
FAQ
What is OTIF vs. fill rate?
Fill rate measures whether a part was available internally when requested. OTIF measures the full delivery chain, timing and completeness together, so a dealer can have a strong fill rate but weak OTIF if freight or dispatch breaks down after the part leaves the shelf.
What is an acceptable fill rate?
There’s no single universal number. Many dealers target a high fill rate for high-demand, stock-status parts, while slower-moving or supplemental items can run lower without hurting service outcomes, based on PartsEdge’s benchmarking guidance.
How do you calculate fill rate?
Divide the number of requests fulfilled immediately from available stock by total parts requests, then multiply by 100. A dealer-specific version subtracts lost sales, special orders, and emergency orders from total parts sold to get a more accurate picture of true shelf availability.
Does fill rate differ from order fill rate or line fill rate?
Yes. Parts fill rate typically tracks individual part requests, while order fill rate measures whether an entire order shipped complete, and line fill rate sits between the two by tracking each line item on that order. Segmenting your reporting by these levels prevents a strong order-level number from masking shortages on specific critical parts.