7 Rental KPIs Equipment Dealers Must Track and Fix Using a Dealer DMS
By MDMS Team · 18 September 2026

7 Rental KPIs Equipment Dealers Must Track and Fix Using a Dealer DMS
Seven numbers drive rental profitability: time utilization, dollar utilization, average rental rate (ADRR), maintenance cost per operating hour, fleet age, ancillary revenue, and specialty mix. Dollar utilization is the single best composite metric because it folds fleet productivity and pricing into one figure. Review time utilization and revenue weekly; review fleet age, maintenance cost, and mix monthly.
TL;DR:
- Dollar utilization remains the most crucial KPI, with ideal blended fleet targets between 35% and 42%, and specialty segments reaching up to 55%.
- Weekly reviews should focus on time and dollar utilization, while fleet age, maintenance costs, and ancillary revenue are best monitored monthly.
- Maintaining a fleet age between 42 and 54 months helps control repair costs, and staged replacement is recommended for units exceeding this range.
- For accurate KPI insights, tracking by asset class and seasonality is essential, avoiding reliance on blended industry averages.
- Dealer-specific systems like ModernDMS enable automated KPI tracking, saving time and improving data accuracy across rental, maintenance, and financial metrics.
Table of Contents
- What Are the Core Rental KPIs to Track?
- How Do You Calculate and Benchmark These KPIs?
- How Often Should You Report Rental KPIs?
- What Should You Do When a KPI Misses Target?
- Why Do Customer Retention and Satisfaction Metrics Matter?
- How Do You Optimize Occupancy Rate and Utilization?
- How Do You Run a Break-Even Analysis on Rental Fleet?
- What Is Your Cost Per Rental Transaction?
- How Do Seasonal Trends Affect KPI Interpretation?
- How Do You Benchmark Rental KPIs Against Industry Standards?
- Why Dealer-Grade Systems Matter for KPI Accuracy
- Turning Rental KPIs Into a Working Dashboard
- Sources
- FAQ
What Are the Core Rental KPIs to Track?
Each rental KPI answers a different question about your fleet, and confusing them is how dealers end up chasing the wrong fix. Here’s what each one actually tells you, and where the number should land if your operation is healthy.
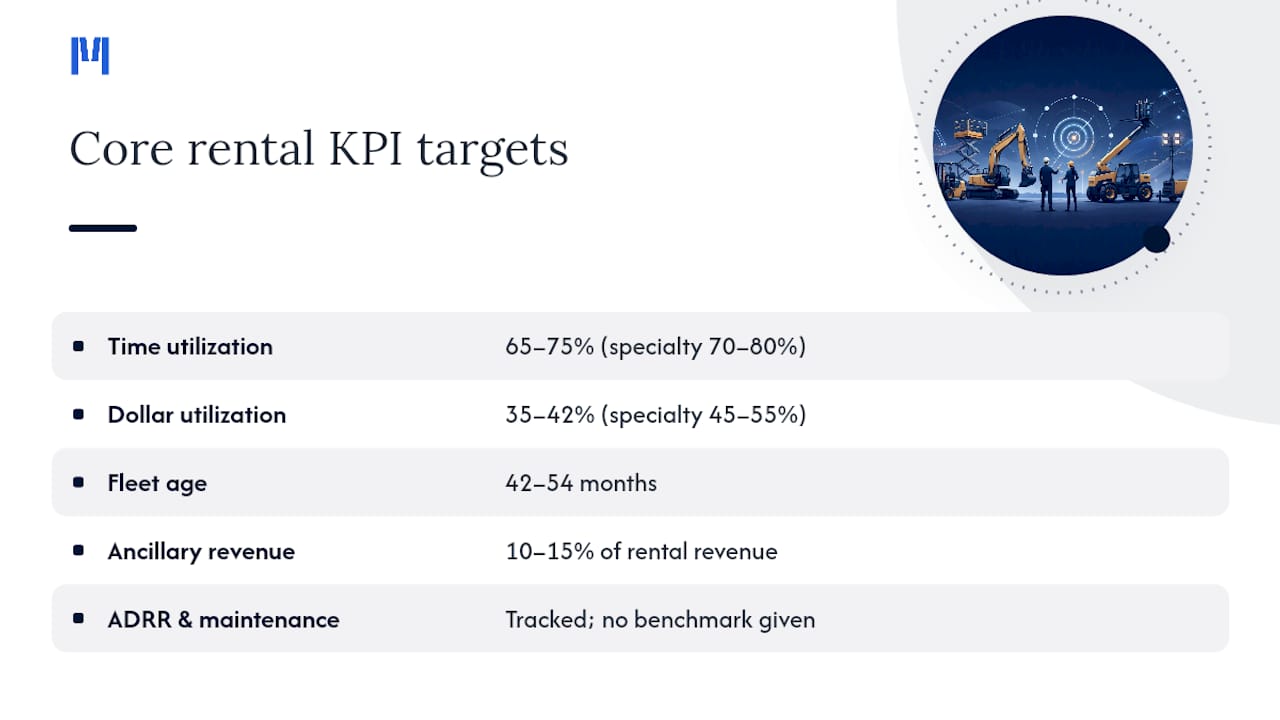
Time utilization measures the percentage of available days a unit is on rent. Healthy fleets run 65% to 75%, though specialty equipment often pushes higher, into the 70% to 80% range, because there’s less of it to go around.
Dollar utilization divides annualized rental revenue by the average original equipment cost (OEC) of the fleet. It’s the number that matters most because a unit sitting idle three days a week but renting at a premium rate can still outperform a unit that’s busy every day at a discount. Blended fleets typically land between 35% and 42%, with specialty segments reaching 45% to 55%.
ADRR (average daily rental rate) interacts directly with dollar utilization. Push rates too hard and time utilization drops as customers balk; price too low and you can hit high utilization while starving margin.
Maintenance cost per operating hour tracks what it costs to keep a unit running, per hour it’s actually working, not per hour it sits on the yard.
Fleet age, measured in months, has a workable target band of 42 to 54 months. Push past that and repair costs and downtime start eating your margin; replace too early and you’re carrying CapEx you didn’t need to.
Ancillary revenue, delivery, damage waiver, and fuel should run 10% to 15% of total rental revenue, and it carries far better margin than the base rental rate itself.
How Do You Calculate and Benchmark These KPIs?
Getting the formula right matters less than getting the inputs right. Most dealers who distrust their own numbers have a counting problem, not a math problem.
- Time utilization = days on rent ÷ available days (calendar days minus scheduled maintenance and planned downtime), expressed as a percentage. MovoGo’s benchmark guide stresses using available days, not calendar days. A unit down for two weeks of scheduled service shouldn’t count against you the same way an idle, rent-ready unit does.
- Dollar utilization = annualized rental revenue ÷ average OEC of the fleet.
- ADRR = total rental revenue ÷ total rental days across the fleet or asset class.
- Maintenance cost per operating hour = total maintenance spend ÷ total operating hours logged (from telematics or meter readings, not calendar time).
- Fleet age = average age in months across units, weighted by OEC so your big-ticket assets carry proportional weight.
- Ancillary ratio = ancillary revenue ÷ total rental revenue.
Worked example, time utilization: A skid steer sits available for 300 days in a year (365 minus 65 days of scheduled service and holidays) and rents for 210 of those days. That’s 210 ÷ 300 = 70%, squarely inside the healthy band.
Worked example, dollar utilization: That same skid steer has an OEC of $45,000 and generates $18,500 in rental revenue for the year.
Two traps wreck these numbers before they even reach a dashboard. First, counting calendar days instead of available days makes utilization look artificially low on units that were legitimately down for service. Second, blending used-equipment sales revenue into rental revenue inflates dollar utilization and hides how the actual fleet is performing. Keep those revenue streams separate in your general ledger and in every report you build off it.
How Often Should You Report Rental KPIs?
A KPI nobody looks at until quarter-end is just an autopsy. Rental fleets move too fast for that, and the right cadence depends on how quickly the number can drift and how costly it is to miss the drift.
Daily, at the branch level, track on-rent unit counts and scheduled deliveries and pickups. This is operational housekeeping, not analysis, but it’s how a branch manager catches a scheduling conflict before it becomes a customer complaint.
Weekly, operations should review time utilization by asset class, dollar utilization, and replacement response time (how fast a broken-down unit gets swapped). Industry guidance points to weekly review as the right rhythm for both utilization and revenue, since a slow week left unaddressed for a month compounds fast.
Monthly, fleet and finance need visibility into fleet age, specialty mix, and ancillary attach rate, metrics that move slowly and don’t need daily eyes but will quietly erode margin if ignored for a quarter.
Quarterly, leadership reviews the full rental P&L against CapEx plan, deciding whether replacement schedules and fleet mix are still tracking toward the year’s targets.
Build your dashboard in layers that match this cadence: a daily operational view, a weekly performance view, and a monthly and quarterly strategic view. Set alert thresholds, say, utilization dropping more than 10 points week over week, so exceptions surface without anyone having to hunt for them.
What Should You Do When a KPI Misses Target?
A number outside its benchmark band is a diagnosis, not a verdict. What you do next depends on which KPI moved and by how much.
- Low time utilization: Test a rate cut on the specific asset class before assuming it’s a demand problem. If pricing isn’t the issue, market that class directly to segments that use it seasonally, and if a unit has been idle for 90-plus days, consider redeploying it to another branch or selling it before it drags down fleet-wide numbers.
- Lagging dollar utilization: Run a controlled ADRR test, raise rates 5% to 8% on your highest-demand classes and watch whether utilization holds. Increase ancillary attach rate through delivery and damage-waiver bundling at the point of quote, and revisit whether your fleet mix still matches what customers are actually renting.
- Rising maintenance cost per operating hour: Pull telematics data to find whether the cost spike traces to one asset class, one vendor, or one operator behavior pattern. Renegotiate vendor service rates if the spike is systemic, or shift to a more proactive service schedule if it’s driven by breakdowns rather than wear.
- High fleet age: Move to staged replacement rather than a single large CapEx event, and prioritize replacing specialty units first since they carry higher margin and higher utilization ceilings.
Pro Tip: Look at rolling 90-day averages by asset class before reacting to any single week’s number. A three-week dip in aerial lift utilization during a rainy stretch is weather, not a pricing problem, but the same dip sustained across a quarter is a signal worth acting on.
Why Do Customer Retention and Satisfaction Metrics Matter?
Contract renewal rate and repeat-rental frequency deserve a permanent seat next to utilization and revenue, because a fleet running at 70%) time utilization on constant new customer acquisition costs far more to sustain than the same number built on repeat business. Retention-focused strategies show that keeping an existing customer renting is consistently cheaper than winning a new one, and the same logic applies directly to rental accounts.
Track contract renewal rate (the share of expiring rental agreements that get extended or replaced by the same customer) alongside a basic satisfaction signal, whether that’s a post-return survey score or simply complaint volume per hundred contracts. A dealer with strong utilization but a renewal rate under 40% is likely masking a service or communication problem behind decent asset numbers.
Average rental duration matters here too. Longer average holds usually mean stickier customer relationships and lower administrative overhead per dollar of revenue, since you’re not re-quoting, re-inspecting, and re-delivering every few days. If your average duration is shrinking while your customer count holds steady, that’s often a sign customers are shopping shorter terms elsewhere and only coming to you for overflow needs, a warning sign worth investigating before it shows up in the harder revenue numbers.
How Do You Optimize Occupancy Rate and Utilization?
Occupancy rate, the share of your fleet actively on rent at a given moment, is the real-time cousin of time utilization, and the two should move together over any meaningful stretch. When they diverge, something operational is broken.
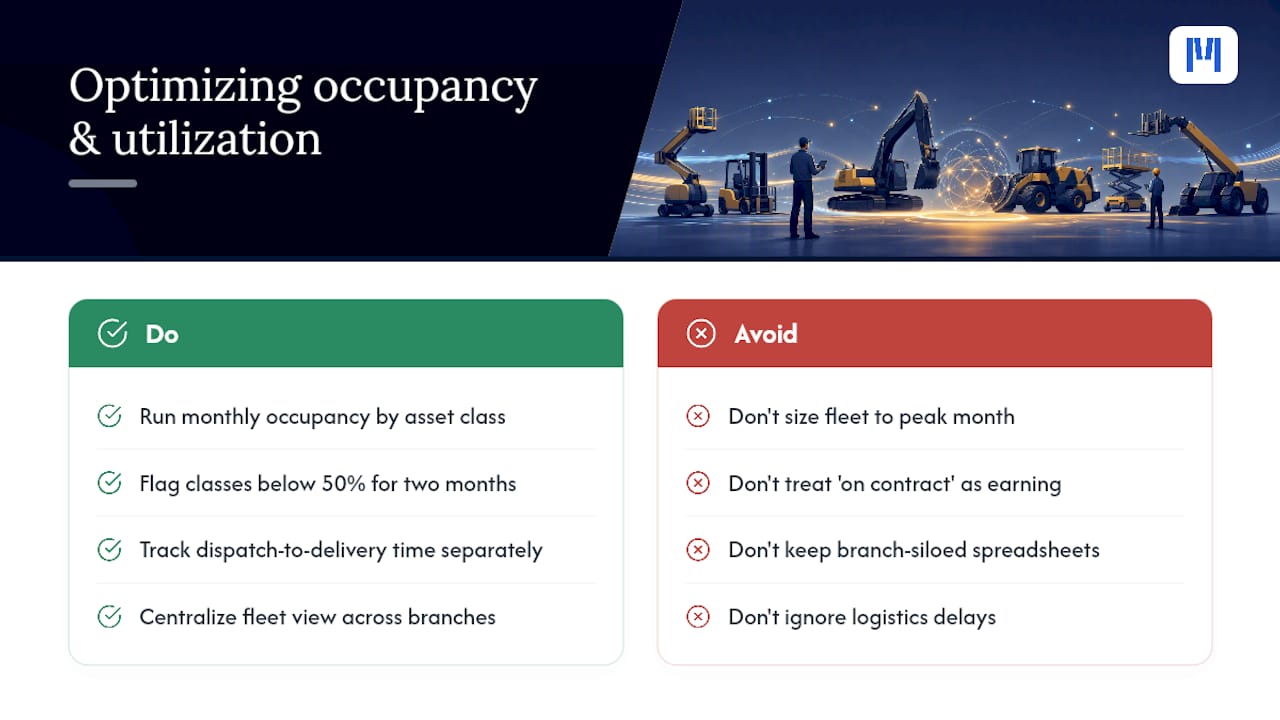
The fastest lever for optimizing occupancy is right-sizing the fleet to actual demand curves rather than to your best month ever. Dealers who bought aggressively during a demand spike often carry occupancy-dragging excess capacity for years afterward. Run occupancy by asset class monthly and flag any class sitting below 50% for two consecutive months as a candidate for redeployment, resale, or aggressive repricing.
Delivery logistics also drive occupancy more than most managers assume. A unit that’s rented but stuck on the yard waiting for a truck slot isn’t earning, even though it shows as “on contract” in some systems. Track dispatch-to-delivery time separately from rental status so you can see whether logistics friction is quietly capping your effective occupancy below what your contracts suggest.
Cross-branch transfers are the other major optimization lever. A dozer sitting idle at one branch while a sister branch turns down rental requests for the same class is a coordination failure, not a fleet-size problem. A centralized fleet view across locations, rather than branch-siloed spreadsheets, is usually what separates dealers who solve this from dealers who keep buying redundant equipment to cover gaps that already exist elsewhere in their own network.
How Do You Run a Break-Even Analysis on Rental Fleet?
Break-even for a rental unit is the utilization rate at which rental revenue covers ownership cost, financing, insurance, and allocated maintenance, before it contributes a dollar of profit. Calculate it by dividing monthly fixed ownership cost by the ADRR for that asset class, which tells you how many rental days per month the unit needs just to clear its own overhead.
A unit with $1,200 in monthly fixed cost and a $150 daily rate needs eight rental days a month to break even. Anything above that is contribution margin; anything consistently below it means the unit is losing money every month it stays in the fleet, regardless of what your overall fleet-level utilization number shows.
This is where fleet-average KPIs can mislead you. Run break-even by unit, not just by class average, at least quarterly, and treat any unit that’s missed break-even for two consecutive quarters as a disposal or repricing candidate rather than a rounding error in a bigger, healthier number.
Profitability thresholds should also account for financing structure. A unit purchased outright has a lower break-even bar than one carrying a loan or lease payment, so comparing break-even across units bought under different financing terms without adjusting for that difference will send you chasing the wrong fixes.
What Is Your Cost Per Rental Transaction?
Cost per rental transaction captures the administrative and overhead burden of processing a single rental contract, quote through return inspection, and it’s a number most dealers have never actually calculated. Add up rental department labor, billing overhead, and allocated administrative cost for a period, then divide by the number of rental transactions processed in that same window.
This metric matters most when you’re comparing transaction types. A high-volume, low-dollar rental (a generator out for a weekend) can carry nearly the same processing cost as a high-dollar, long-term rental (a crane out for three months), which means your smallest transactions are often your least profitable on a cost-to-serve basis, even when the headline rental rate looks fine.
Overhead allocation gets messy fast if you’re splitting costs evenly across every transaction regardless of contract size or duration. A better approach ties overhead allocation to transaction complexity: number of line items, delivery legs, and contract modifications, rather than a flat per-contract rate. Dealers who make this shift usually discover that short-term, small-equipment rentals need either a minimum rental fee or a streamlined self-service booking path, because the current cost to process them barely leaves any margin once labor is properly counted.
How Do Seasonal Trends Affect KPI Interpretation?
A utilization number in isolation tells you almost nothing without the season attached to it. Aerial equipment and earthmoving classes swing hard between peak construction months and winter slowdowns, and comparing a July utilization figure to a January one without adjusting for that is a common way managers misread their own fleet.
The fix is comparing KPIs against the same period a year earlier, not against last month, for any asset class with real seasonal demand. A 15-point utilization drop from June to July might be entirely normal for your market if you check the prior year and find the same pattern, while an identical drop with no seasonal precedent is a real signal worth chasing.
Fleet age and maintenance cost per hour also read differently by season. Heavy summer usage months typically show climbing maintenance cost per hour simply because units are logging more hours, and that’s a sign of a healthy, working fleet, not a maintenance problem. The same maintenance cost climbing during a slow winter month, when hours logged are low, points to a real mechanical or service issue that summer usage would otherwise mask.
Build seasonality into your benchmark targets rather than applying one flat band all year.
How Do You Benchmark Rental KPIs Against Industry Standards?
Benchmarks only work when you’re comparing like to like. Market reports covering the construction equipment rental sector consistently name utilization, maintenance cost per operating hour, average rental rate, uptime compliance, and replacement response time as the core metrics dealers should track against sector-wide figures, and those are the same numbers this article has walked through.
Where benchmarking gets misused is applying a single blended target across a mixed fleet. A general-purpose compact fleet and a specialty aerial fleet shouldn’t be held to the same utilization band, and market-specific research on heavy construction equipment rental highlights average rental duration and customer retention as equally important context alongside raw utilization, particularly for dealers competing on service rather than just price.
The most useful benchmarking practice is internal: track your own KPIs by asset class over a rolling 24-month window before leaning too hard on external averages. External benchmarks tell you whether you’re broadly competitive; your own trend line tells you whether you’re improving. Use both, but weight decisions toward the trend you control.
Why Dealer-Grade Systems Matter for KPI Accuracy
A purpose-built dealer DMS centralizes rental contracts, utilization data, maintenance history, and billing in one place, so the numbers above come from a single source instead of three disconnected spreadsheets. ModernDMS’s rental module sets up in under an hour, keeps your data fully portable with no lock-in, and syncs to Xero for finance reporting. A weekly KPI pack that used to take a rental manager most of an afternoon to assemble by hand can be pulled in minutes once the fleet, contract, and maintenance data already live in one system.
— ModernDMS
Turning Rental KPIs Into a Working Dashboard
Calculating these KPIs by hand every week is exactly the kind of task that eats a rental manager’s Friday afternoon, and it’s the first thing that slips when the branch gets busy. ModernDMS is built specifically for equipment dealerships, not adapted from generic rental software, so utilization, dollar utilization, maintenance cost per hour, and ancillary attach all pull from the same rental and fleet module instead of three disconnected spreadsheets that need manual reconciling every reporting cycle.
The Rental plan runs $59 AUD per month and connects to Xero so your finance team isn’t re-entering rental revenue by hand. Setup takes under an hour, and you keep full ownership of your fleet and contract data if you ever decide to switch systems. If your weekly KPI pack currently takes an afternoon to build, check current pricing and see what a dedicated rental module would save your team.
Sources
- The nine KPIs that actually run a Construction Equipment Rental business in 2027 — PulseRevOps
- Equipment Rental KPIs Dashboard — Modeliks
- What is rental utilisation? Formula & benchmarks — MovoGo
FAQ
What Is the Most Important Rental KPI to Track?
Dollar utilization is the single most important rental KPI because it combines fleet productivity and pricing into one number. It’s calculated as annualized rental revenue divided by average original equipment cost, with blended fleets typically landing between 35% and 42%.
What Is a Good Time Utilization Rate for Rental Equipment?
A healthy time utilization rate for general rental fleets falls between 65% and 75%, calculated as days on rent divided by available days.
How Often Should Rental KPIs Be Reviewed?
Utilization and revenue KPIs should be reviewed weekly, since they can shift fast enough to need quick action. Fleet age, maintenance cost, and specialty mix move slower and are better suited to a monthly review, with a full quarterly finance check against your CapEx plan.
How Much Should Ancillary Revenue Contribute to Rental Income?
Ancillary revenue, delivery, damage waiver, and fuel, should typically make up 10% to 15% of total rental revenue. It carries higher margin than the base rental rate, making attach rate a meaningful lever for overall profitability.
How Does ModernDMS Help Track Rental KPIs?
ModernDMS centralizes rental contracts, fleet utilization, and maintenance costs in one system so KPIs pull automatically instead of requiring manual spreadsheet work. The Rental plan costs $59 AUD per month, integrates with Xero, and sets up in under an hour.