6 Monthly Fixes for Rental Utilization Reporting for Equipment Dealers
By MDMS Team · 13 September 2026

6 Monthly Fixes for Rental Utilization Reporting for Equipment Dealers
Rental utilization reporting measures how often your equipment is on rent and how much revenue it returns against its original cost. Managers who run this well track two numbers together: time utilization and financial utilization. Both, reviewed monthly rather than once a year, tell you which assets to fix, price differently, or sell.
TL;DR:
- Overestimating available rental days by excluding idle yard time skews utilization metrics, hiding real revenue leaks and asset performance issues.
- Monthly calculations must exclude maintenance and mechanical failure days from available days, but include unmarketed idle days to reflect true utilization.
- Combining time and financial utilization reports reveals whether assets are underpriced, overused, or underperforming, guiding appropriate management actions.
- Using multiple tools like spreadsheets, telematics, and integrated management platforms ensures accurate, real-time utilization data, reducing reporting errors.
- Maintaining consistent, auditable reports aligned with financial records and compliance standards enhances operational transparency and decision-making.
Table of Contents
- What Counts as Rental Utilization Reporting?
- How Do You Calculate Rental Utilization?
- What Should a Rental Utilization Report Include?
- Which Tools Actually Produce Reliable Utilization Reports?
- What Utilization Rate Should You Be Targeting?
- How Do You Actually Raise Utilization This Month?
- How MDMS Automates the Reporting Grind
- Are There Compliance Rules Around Rental Utilization Reporting?
- Perspective: Make Utilization Reporting a Management Ritual
- See How MDMS Handles Rental Reporting for Your Fleet
- Sources
- FAQ
What Counts as Rental Utilization Reporting?
Utilization reporting has three flavors, and confusing them is the most common analytical mistake in rental operations.
Time (physical) utilization measures how many days an asset was actually on rent versus how many days it could have been rented. This is the metric most managers mean when they say “utilization.”
Financial (dollar) utilization measures revenue generated against the equipment’s original cost. A forklift that’s rented constantly at a bargain rate can post strong time utilization and weak dollar utilization at the same time.
Operational utilization, tracked through engine hours or telematics, measures how hard the equipment worked while it was out. It matters most for machines billed on usage rather than calendar days, like excavators or generators.
The mistake: relying on just one number. That gap only shows up when you calculate both.
- Time utilization: best for capacity planning and fleet sizing decisions
- Financial utilization: best for pricing decisions and asset replacement timing
- Operational utilization: best for maintenance scheduling on hour-billed equipment
How Do You Calculate Rental Utilization?
The two core formulas behind rental utilization reporting are straightforward, but the denominators trip up most operators.
- Time utilization = (Days on rent ÷ Available rental days) × 100
- Financial utilization = (Trailing 12-month rental revenue ÷ original equipment cost) × 100
Getting the denominator right matters more than the formula itself. Available rental days should exclude days the unit genuinely couldn’t be rented, like scheduled maintenance or a documented mechanical failure. It should NOT exclude days the asset simply sat idle in the yard because no one marketed it. That distinction is where “available” gets quietly inflated into “false availability,” a pattern that flatters your utilization percentage while hiding real revenue loss.
RentalBench’s utilization framework recommends reviewing financial utilization on a trailing 12-month basis specifically to smooth out seasonal spikes, since a single strong month can mask a mediocre year.
Worked example, time utilization: A mini excavator was on rent 210 days out of 300 available days in the period. That’s (210 ÷ 300) × 100 = a moderate time utilization.
Worked example, financial utilization: That same excavator generated $28,000 in rental revenue over the trailing 12 months against a $70,000 original cost. That’s (28,000 ÷ 70,000) × 100 = moderate financial utilization, a signal the day rate may be too low even though the asset stays busy.
What Should a Rental Utilization Report Include?
A usable report needs consistent fields at the asset level, then rolls up into fleet and category KPIs. Skip a field here and your monthly trend becomes unreliable within a quarter.
- Item ID and equipment category
- Available days and billed (on-rent) days for the period
- Billed revenue and original equipment cost
- Maintenance days and turnaround days between rentals
- Overdue days and calculated utilization percentage
At the fleet level, track a smaller set of rollup KPIs to spot problems before they compound.
| KPI | What it reveals |
|---|---|
| Fleet-wide utilization | Overall asset productivity across the whole rental book |
| Category utilization | Which equipment classes are over or underperforming |
| Revenue per available day | Whether pricing matches actual demand |
| Maintenance downtime % | Whether service scheduling is eating rentable days |
| Missed rental requests | Demand you turned away due to fleet gaps |
Run this monthly, not quarterly. A quarterly cadence hides a bad month inside a decent quarter, and by the time you spot a turnaround-time problem or a pricing gap, you’ve already lost three months of billable days on the affected units. Monthly reporting, paired with a rental and hire fleet management system that pulls fields automatically from live contracts, turns this from a spreadsheet chore into a fifteen-minute review.
Which Tools Actually Produce Reliable Utilization Reports?
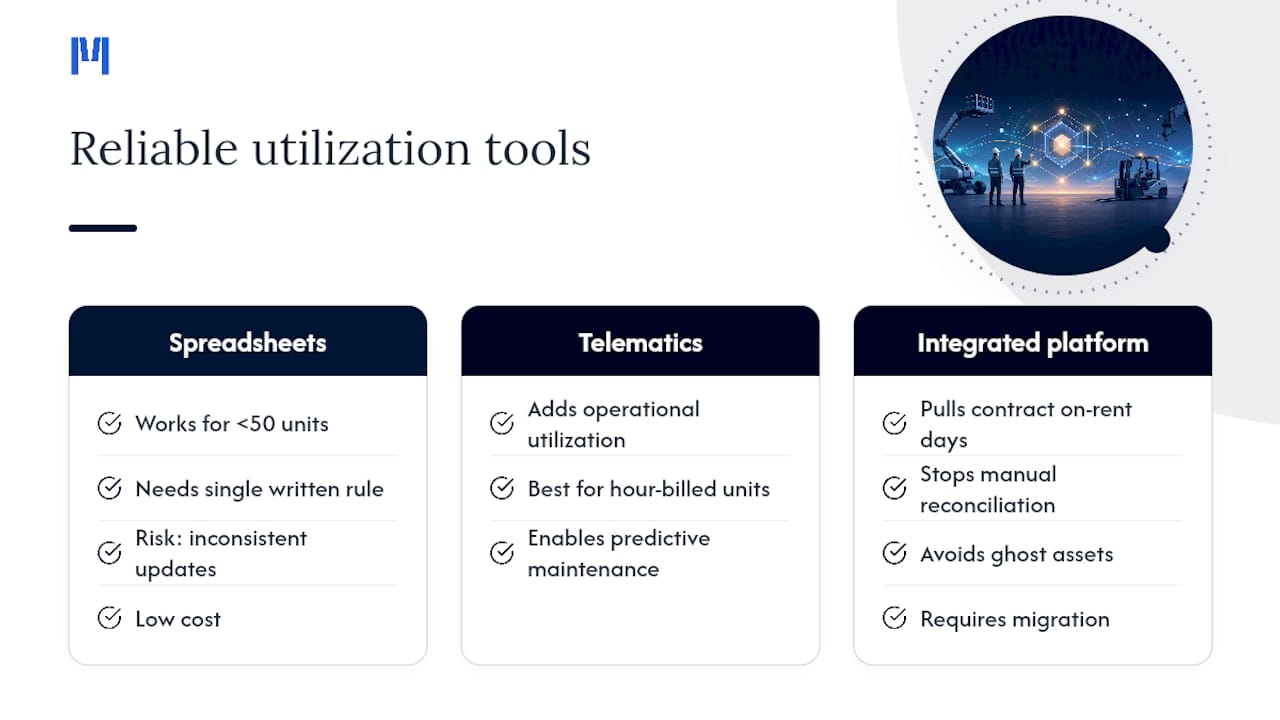
Three approaches dominate, and most rental operations use some combination of all three as they grow.
Spreadsheets work fine for small fleets under roughly 50 units, provided someone enforces a single, written definition of “available days” across every tab. The failure mode isn’t the spreadsheet itself. It’s that two different people update it with two different assumptions about maintenance days, and by month three the numbers don’t mean anything.
Telematics and engine-hour data add operational utilization on top of time and dollar metrics. This matters most for hour-billed equipment, where a machine can sit on a job site for 20 days but only run for 60 hours. It also feeds predictive maintenance scheduling, since hour thresholds trigger service before a breakdown eats a rental day.
Integrated rental or dealer management platforms pull on-rent days and billed revenue directly from the contract, removing the manual reconciliation step entirely. DataNet’s asset tracking research makes the case plainly: visibility that stops at delivery, rather than following the asset through deployment, maintenance, and return, creates open contracts and ghost assets that quietly distort every utilization number downstream.
Pro Tip: Before you migrate core systems, build a lightweight “availability and utilization logic layer” that standardizes your available-day definition and pulls status data from whatever you already run. Prove the ROI on paper first, then decide if a full platform switch is worth it.
What Utilization Rate Should You Be Targeting?
There’s no single healthy number, but a useful range exists for most general rental fleets: mid-60s to mid-70s percent time utilization. Specialty or seasonal equipment runs lower without it signaling a problem, and high-turnover consumables like small tools often run higher.
Klipboard’s ANZ construction equipment benchmark research found many operators sitting below 70%, with turnaround time, maintenance bottlenecks, and revenue leakage cited as the recurring causes.
Reading time and financial utilization together, as a pair, tells you what to do next.
- High time, high dollar: the asset is working well. Consider adding more units to this category.
- High time, low dollar: the asset is busy but underpriced. Raise rates or renegotiate long-term contracts.
- Low time, high dollar: rare, usually premium specialty gear rented occasionally at strong margins. Leave it alone.
- Low time, low dollar: underperforming asset. Candidate for transfer to another branch or outright sale.
Rouse’s rental market benchmarking aggregates invoice and fleet-snapshot data across many operators to provide market and asset-class context. Treat those figures as a reference point, not a target. Your own trailing 12-month trend, weighted by original equipment cost, tells you more about your specific fleet than any industry-wide average.
How Do You Actually Raise Utilization This Month?
Fixing utilization starts with cleaning the data, because a chunk of every “low utilization” problem is really a reporting error, not an operational one.
- Close overdue rentals and reconcile open contracts. An asset marked “on rent” that actually came back three weeks ago is inflating your denominator with a ghost day.
- Cut turnaround time with a defined SLA. If it takes four days to inspect, clean, and re-list a returned unit, that’s four unbillable days per rental cycle, multiplied across your whole fleet.
- Schedule maintenance during naturally slow windows rather than whenever the shop has a slot open, so service doesn’t cannibalize a period you’d otherwise be renting.
- Reprice underperformers flagged by low financial utilization before assuming the asset itself is the problem.
- Transfer slow-moving inventory to a branch with stronger demand for that category rather than letting it sit idle at one location.
- Sell or retire assets that stay in the low/low quadrant for two or three consecutive reporting periods.
Pro Tip: Track missed rental requests as seriously as you track utilization. A high utilization rate next to a growing pile of turned-away customers means you have a fleet-sizing problem, not a pricing win.
Measurement discipline matters as much as the operational fixes. Standardize your denominator definition in writing, audit for ghost assets quarterly, and log every missed request so demand you can’t currently serve still shows up somewhere in the report.
How MDMS Automates the Reporting Grind
A dealer management system built with a rental contract and fleet module captures on-rent days and billed revenue directly from the contract record the moment it’s signed or closed out, rather than waiting for someone to reconcile a spreadsheet at month end. That’s the difference between a report that’s three weeks stale and one that’s current the day you open it.
MDMS is built for equipment dealerships running rental alongside sales, service, and parts, with full data ownership so a report you build today isn’t locked into a vendor you might outgrow. Xero integration keeps billed revenue figures consistent between your rental dashboard and your books.
If you’re not ready for a full system change, start smaller.
- Build one monthly dashboard combining time and financial utilization by category
- Pull maintenance and turnaround days into the same view before adding more fields
- Prove the reporting layer works with your current process before considering a broader asset lifecycle migration
Are There Compliance Rules Around Rental Utilization Reporting?
Utilization reporting itself isn’t subject to a formal accounting standard the way revenue recognition is, but several adjacent obligations shape how you build and retain these reports.
Rental revenue still has to reconcile with your books under standard bookkeeping and tax obligations, so the billed revenue figure in your utilization report needs to match what’s recorded in your finance system, not a rounded or estimated version of it. Discrepancies between an internal utilization report and your Xero or MYOB ledger are exactly the kind of gap an auditor flags first.
If your fleet includes plant or equipment subject to safety inspection regimes, maintenance days logged in your utilization report should tie back to documented service and inspection records. Treating an asset as “available” during a period when it legally couldn’t be operated, because a required inspection had lapsed, isn’t just a utilization distortion. It’s a record that contradicts your own compliance documentation if a regulator or insurer ever asks for it.
Retain your monthly utilization reports and their underlying contract data for as long as your general financial record-keeping obligations require, since these reports increasingly double as evidence in disputes over billed days, damage claims, or contract overruns. Keeping the denominator definition and source data consistent isn’t only good practice for trend analysis. It’s what makes a report defensible if anyone outside your operations team ever needs to review it.
Perspective: Make Utilization Reporting a Management Ritual
The operators who improve utilization aren’t the ones with the fanciest dashboard. They’re the ones who put it on a recurring meeting agenda with a named owner for each flagged asset category, every month, without exception.
A simple structure works: five minutes on fleet-wide trend, ten minutes on categories that moved into the low/low quadrant, and one owner assigned per flag to run a small experiment, a repricing test, a transfer, a turnaround-time fix, before the next meeting. Resist the urge to react to a single month’s dip. One weak percentage is noise. Three consecutive weak months in the same category is a decision waiting to be made.
— ModernDMS
See How MDMS Handles Rental Reporting for Your Fleet
Most rental operators choose between two frustrating paths: keep patching together spreadsheets that drift out of sync every quarter, or commit to a massive system migration before they’ve even proven the reporting logic works. MDMS gives you a third option: rental contract capture, utilization dashboards, and asset lifecycle tracking built into a dealer management system you can set up in under an hour, with data you own outright and Xero integration that keeps your revenue figures consistent everywhere they’re reported.

Start where the risk is lowest. Build one monthly utilization dashboard inside the rental management platform using the fields covered above, on-rent days, billed revenue, maintenance downtime, and see the picture before you commit to anything larger. If you’re ready to move past spreadsheets entirely, request a demo of the rental and hire fleet module and walk through your own fleet data with the team that built it.
Sources
- Equipment Rental Utilization: Time and Dollar Formulas | RentalBench
- Rental equipment tracking — DataNet IOT
- Rouse Rental Insights
FAQ
What Is the 30% Rental Rule?
It’s a rough screening tool, not a formal financial utilization target, and works best alongside your own trailing 12-month dollar utilization figure.
What Is the Formula to Calculate Utilization?
Time utilization is calculated as (Days on rent ÷ Available rental days) × 100. Financial utilization is calculated as (Trailing 12-month rental revenue ÷ original equipment cost) × 100, and both should be tracked together.
How Do You Calculate Utilization of Equipment in Practice?
Pull billed (on-rent) days and available days for the reporting period from your contract records, then apply the time utilization formula, making sure available days exclude only genuine downtime like maintenance, not unmarketed idle time. A rental fleet management system that captures contract dates automatically removes most of the manual reconciliation error here.
What Does Time Utilization Mean?
Time utilization measures the percentage of available rental days an asset actually spent on rent during a given period. It answers a capacity question, how often the asset earns, rather than a profitability question, which is what financial utilization measures instead.