Recover Margin This Week With Parts Margin Analysis for Parts Managers
By MDMS Team · 14 September 2026

Recover Margin This Week With Parts Margin Analysis for Parts Managers
Run a parts margin analysis now this week, before another invoice cycle buries the leak deeper. Pull your parts sales against landed cost, calculate your blended parts gross margin, and check it against your parts-to-labor ratio. That single exercise typically surfaces underpriced SKUs, aging stock nobody has flagged, and a labor imbalance that’s quietly capping your department’s earnings.
TL;DR:
- Conduct weekly price audits on high-velocity SKUs to catch supplier cost changes early and prevent margin erosion.
- Build a parts pricing matrix based on landed cost rather than list price to automatically adjust for supplier price fluctuations.
- Keep obsolescence below 5% of inventory value and maintain a first-fix rate above 90% to maximize inventory efficiency and technician productivity.
- Focus on correcting low-margin SKUs from the bottom 20 list promptly, as fixing these can recover significant profit quickly.
- Use live data dashboards to monitor blended gross margin, SKU movement, and supply chain shifts continuously, ensuring rapid problem detection and response.
Table of Contents
- What Parts Margin Analysis Actually Measures
- How to Run a Parts Margin Analysis Step by Step
- Pricing Tactics: Building a Matrix That Actually Protects Margin
- Inventory Levers That Move Margin Without Touching a Price Tag
- Keeping the Gains: Dashboards, Cadence, and Live Data
- A Quick Win Worth Chasing First
- Where a DMS Fits Into Your Margin Strategy
- Sources
- FAQ
What Parts Margin Analysis Actually Measures
Parts margin analysis is the process of comparing what you paid for a part against what you sold it for, then rolling those numbers up by SKU, category, and department to find where profit is being made or lost. It sounds simple. Most dealerships still get the math wrong, usually by confusing margin with markup.
Gross margin is profit expressed as a percentage of your selling price. Markup is profit expressed as a percentage of your cost. They are not the same number, and the gap between them causes more pricing mistakes than any other error in a parts department.
- Gross margin % = (Selling Price − Cost) ÷ Selling Price × 100
- Markup % = (Selling Price − Cost) ÷ Cost × 100
- Parts-to-labor ratio = Total Parts Revenue ÷ Total Labor Revenue
- Blended parts gross margin = Total Parts Gross Profit ÷ Total Parts Revenue
Here’s the worked example that trips people up. Say a part costs $70 and sells for $100. That’s a 30% gross margin ($30 profit ÷ $100 price). But the markup on that same part is 42.9% ($30 profit ÷ $70 cost). A parts advisor told to “add 30%” and one told to hit “30% margin” will land on two different prices, and over thousands of transactions that gap adds up to real money left on the table or priced out of the sale.
How to Run a Parts Margin Analysis Step by Step
Start with the data, not the spreadsheet template. You need SKU-level sales history, landed cost (not list price), job card linkage so you know which parts sold through the counter versus through a work order, warranty recovery amounts, and return volumes. Miss the landed cost figure and every calculation downstream is wrong, since freight, duty, and supplier surcharges routinely add several points to true cost.
Once the data is clean, segment it. Break parts into cost bands (under $50, $50 to $250, over $250), separate common maintenance items from hard-to-source specialty parts, and split OEM from aftermarket. This segmentation matters because a single blended margin number hides more than it reveals; a 40% margin on filters and a 12% margin on a rare hydraulic seal can average out to something that looks fine while masking a real problem.
- Clean and reconcile the sales and cost export against your inventory system.
- Calculate margin at the SKU level, not just the category level.
- Roll up by segment to find which categories drag the blended average down.
- Rank contributors: identify your top 20 revenue SKUs and your bottom 20 margin SKUs.
- Investigate root causes on the worst performers: supplier cost creep, stale pricing, or a discount habit nobody’s tracking.
Set a cadence and stick to it. Run a weekly price audit on your highest-velocity SKUs, since landed costs shift more often than most managers assume, and schedule a monthly review of the full parts P&L against your KPI targets.
Pro Tip: Assign one person ownership of the weekly audit, even if it’s a 20-minute task. Margin erosion is rarely one big mistake. It’s dozens of small, unreviewed price changes that pile up over a quarter.
Pricing Tactics: Building a Matrix That Actually Protects Margin
A pricing matrix beats manual, memory-based pricing every time, but only if it’s built on cost, not on OEM list price. A strategic parts matrix tied to actual landed cost adjusts automatically as supplier prices move. A matrix pinned to list price drifts out of date the moment your supplier raises costs, and nobody notices until the monthly P&L comes in soft.
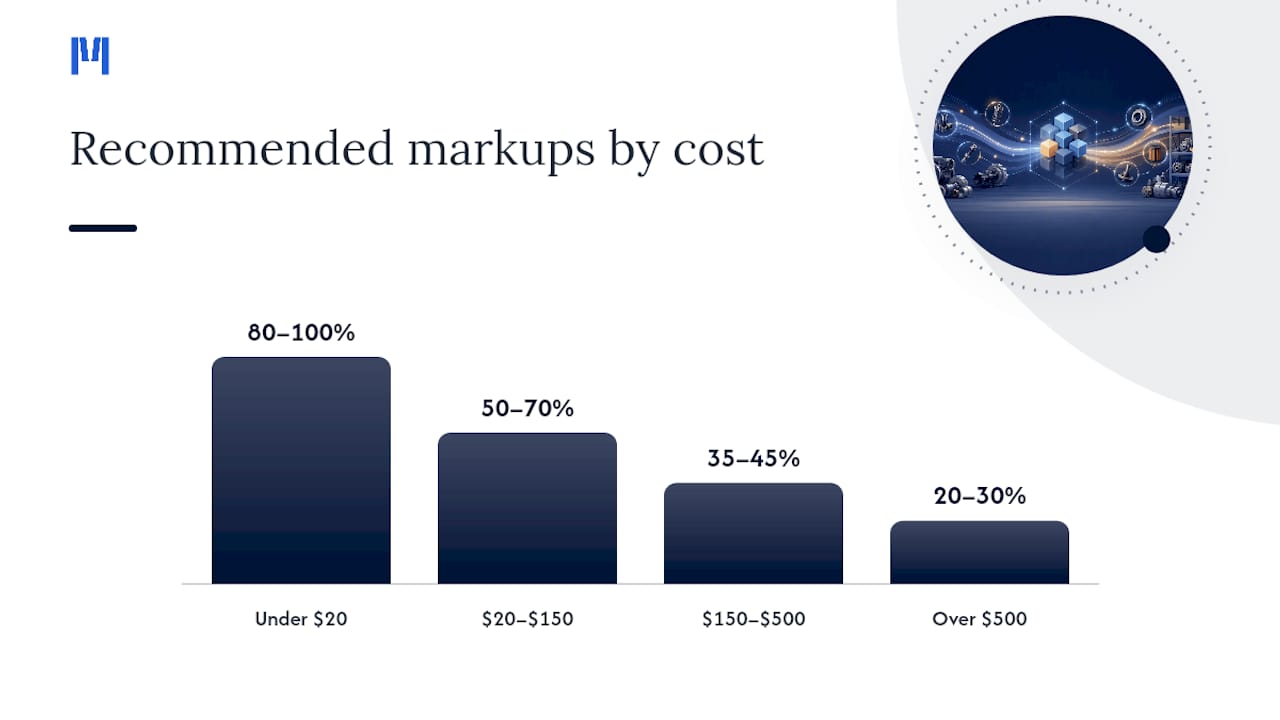
Set your cost bands so cheaper parts carry a higher percentage markup and expensive parts carry a lower one. That’s not arbitrary. Customers barely notice a few extra dollars on a $15 filter, but they will absolutely notice a matching markup applied to a $2,000 component.
- Parts under $20: markup in the 80 to 100% range.
- Parts from $20 to $150: markup roughly 50 to 70%.
- Parts from $150 to $500: markup around 35 to 45%.
- Parts over $500: markup closer to 20 to 30%, adjusted for competition.
Build in exemptions for high-frequency maintenance items, filters, belts, and common seals, where competitive pressure from counter shoppers is highest, and let scarce or hard-to-source parts run heavier margins since there’s little competitive pricing to undercut you. Segmenting by both cost and how easily a customer could buy it elsewhere is what separates a matrix that protects margin from one that just looks organized.
Pro Tip: Automate matrix pricing inside your management system rather than relying on staff memory or a printed sheet. A matrix that isn’t checked weekly is a matrix that’s already out of date.
Inventory Levers That Move Margin Without Touching a Price Tag
Your pricing can be flawless and your margin can still bleed if your inventory is working against you. Three numbers deserve a spot on every parts manager’s weekly dashboard: turns, obsolescence percentage, and first-fix rate.
Obsolescence, stock that hasn’t moved and likely won’t, should stay below roughly 5% of inventory value, since anything higher ties up capital that could be funding faster-moving inventory, according to Keyloop’s data on parts profitability. First-fix rate, the share of jobs completed without waiting on a part, has a widely cited target of 90 to 95%. Fall below that and technicians sit idle waiting on stock, which drags down your parts-to-labor ratio just as surely as underpricing does.
A handful of operational habits move these numbers faster than any pricing change:
- Forecast stock orders against your actual equipment parc, not last year’s blanket order.
- Set drop-ship rules for low-velocity, high-cost items instead of stocking them speculatively.
- Process returns and clearance items on a fixed weekly schedule rather than letting them accumulate.
- Run a dead-stock reduction review monthly, and mark anything untouched for 180 days for clearance pricing.
- Track first-time fix rate alongside stock order participation to catch shortages before technicians notice.
Frequent stocktakes and disciplined returns processing are two of the simplest levers available, and Farm Equipment’s practitioner guidance treats both as routine housekeeping rather than special projects.
Keeping the Gains: Dashboards, Cadence, and Live Data
Margin analysis loses value fast if it’s a quarterly event instead of a running habit. The dealerships that hold their gains build a short list of numbers into a dashboard and check it on a fixed schedule rather than waiting for the monthly financials to reveal a problem that started eight weeks earlier.
Watch blended parts gross margin, top and bottom SKU movers, obsolescence percentage, and fill rate as your core four. Add an automated alert whenever landed cost on a tracked SKU shifts past a set threshold, since that’s usually the earliest sign your matrix pricing has drifted out of sync with reality.
- Daily: cost-change alerts on high-velocity SKUs.
- Weekly: price audit against the matrix, plus fill-rate check.
- Monthly: full parts P&L against blended margin and turns targets.
Live, joined-up data across job cards, stock, and pricing lets managers catch problems while they’re still small instead of after they’ve shown up in a quarterly report. A DMS built around parts and warehouse workflows automates that price-matrix check and links job cards directly to SKU-level margin reporting, which is precisely the connective tissue most legacy systems lack.
Top parts departments benchmark themselves against blended gross margins in the high 30s to low 40s percent range, a useful ceiling to aim toward rather than a number to hit and forget.
A Quick Win Worth Chasing First
Most parts managers find their fastest win in the bottom-20 SKU list, a handful of parts priced years ago and never revisited. Fixing those prices this week, and looping in service and procurement so nobody’s blindsided by the change, usually recovers real margin within a single billing cycle. The habit that sustains it is boring: accurate data, checked weekly, not clever math.
— ModernDMS
Where a DMS Fits Into Your Margin Strategy
Once you’ve found the leaks, the harder problem is keeping them fixed. Spreadsheets catch a bad SKU price once; they don’t alert you the next time a supplier quietly raises landed cost by 4%. That’s the gap a purpose-built system is meant to close.

Look for software that automates your pricing matrix against live landed cost, links job cards directly to parts stock so first-fix data updates in real time, and flags your biggest margin movers and slow-moving SKUs without a manual export. Moderndms builds those capabilities directly into its parts and warehouse management module, so a cost change on a supplier invoice can trigger a matrix update instead of sitting unnoticed for months. Dealerships running equipment fleets specifically can see how the platform handles pricing, stock, and service data together on the heavy equipment dealer software page. If your current setup can’t answer “what’s my blended parts margin right now” without a week of exporting, it’s worth booking a walkthrough to see the difference live data makes.
Sources
- How data drives parts and service profitability at dealerships | Keyloop
- Driving profit through fixed operations: How a strategic parts matrix can keep your dealership thriving | Withum
FAQ
How Do You Do a Margin Analysis?
Pull SKU-level sales and landed cost, calculate gross margin percentage for each part, then roll the results up by category to spot underpriced items and segments dragging down your blended average.
What Are the Three Types of Margin?
Gross margin measures profit after cost of goods sold, operating margin factors in operating expenses like labor and overhead, and net margin accounts for all costs including taxes and interest.
Is a 4% Operating Margin Good for a Parts Department?
No.
What’s a Healthy Parts-to-Labor Ratio?
Most benchmarks put a healthy parts-to-labor ratio between 0.8:1 and 1:1, and a lower ratio usually points to missed upsell opportunities or parts leakage during service jobs.